Monitor Grid metrics
Back to home
On this page
Grid environments consist of:
- App containers: one or more app containers
- Service containers: zero or more service containers
- Worker containers: zero or more worker instances.
Infrastructure metrics report CPU, RAM, and disk space for app and worker containers and CPU and disk space for service containers. These metrics are available for all of your Grid environments.
You can see summaries of the metrics for each container separately in the Console under Services for a given environment. The full details are available under Metrics.
App containers are shown first, with the app name and an image corresponding to the app type. Service containers follow next with the same pattern and worker containers are shown last.
You can collapse the graphs by clicking Hide metrics. The graphs switch to an overview of the average resource utilization for the selected container.
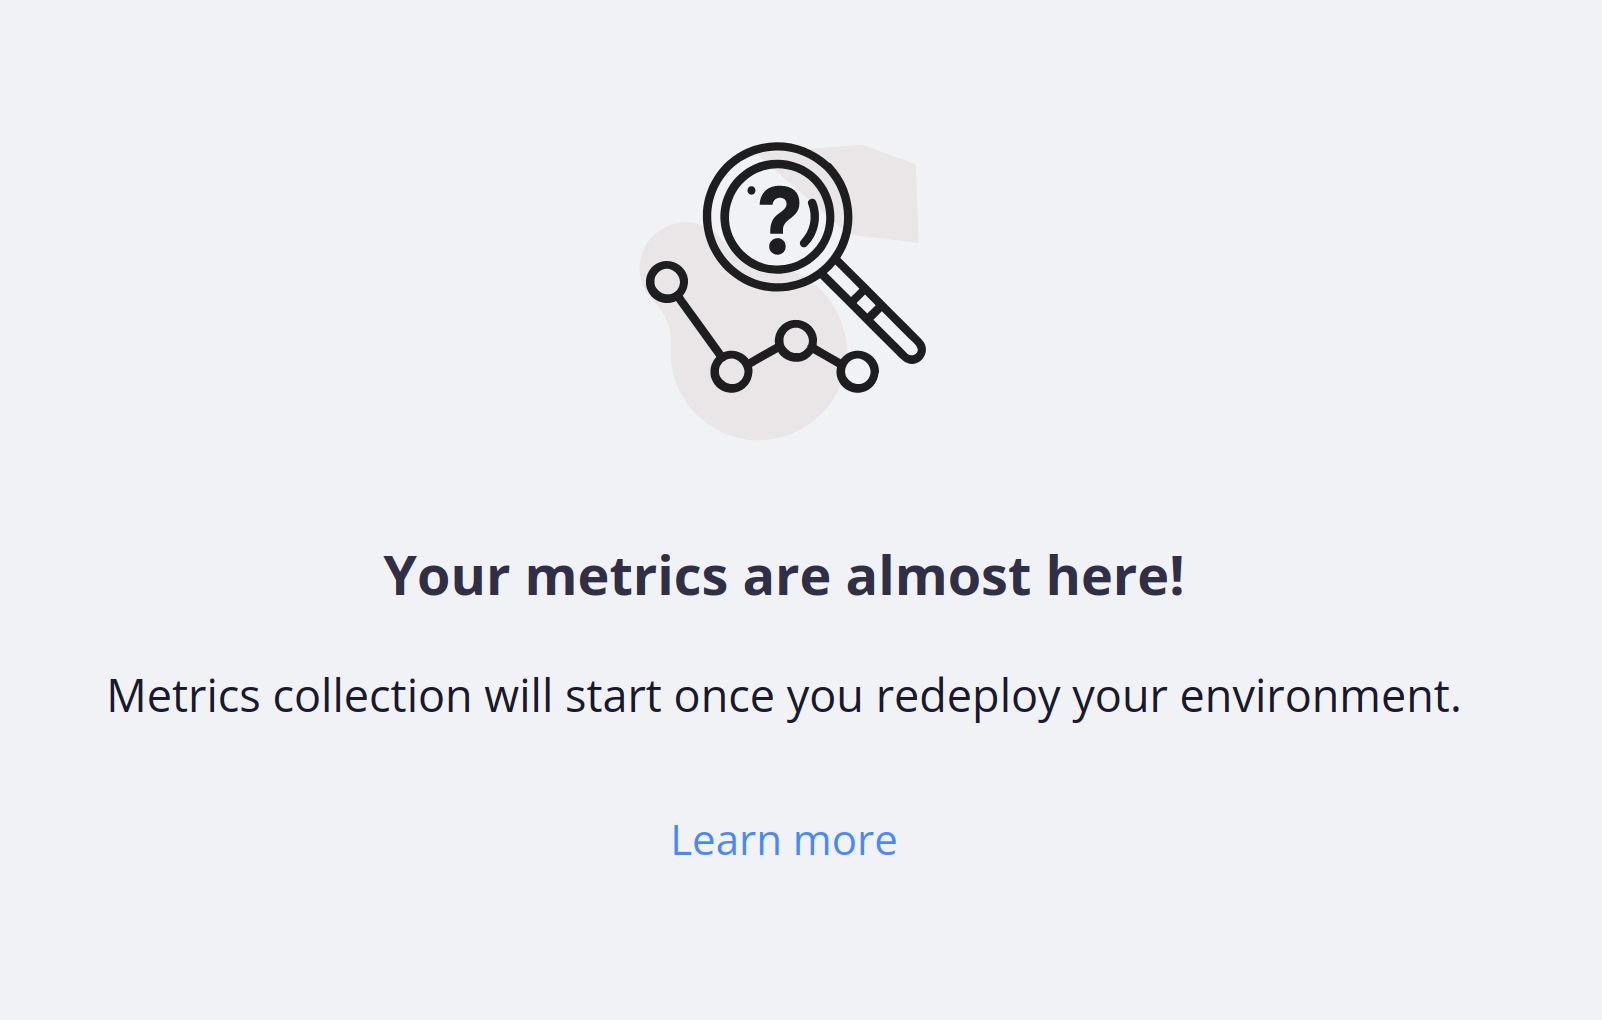
Start metrics collection 
To start collecting metrics on Grid environments, you need to redeploy the environment. If a redeploy is required for the specific environment, you see a note in the Console:
Example of how to read metrics
This example should give you an idea of how the metrics appear. Grid environment metrics show resource usage for each app, service, and worker container.
Note that resources are spread across all containers within the project. So the resources you see for a given container don’t equal the total resources for the project.
This reference project has a single app, two services (PostgreSQL and Redis), and two workers. The plan size for this project is Medium. The appropriate resources have been allocated automatically for each container based on the number and type of containers for this plan size. The graphs show the current average usage in relation to the allocated resources.
Once you’ve read the metrics, see recommendations for action.
App container
Metrics graphs for the app container show CPU, RAM, and disk allocation and usage. The persistent disk has been configured in the app configuration at 9.57 GB, while the temporary disk is 7.99 GB.
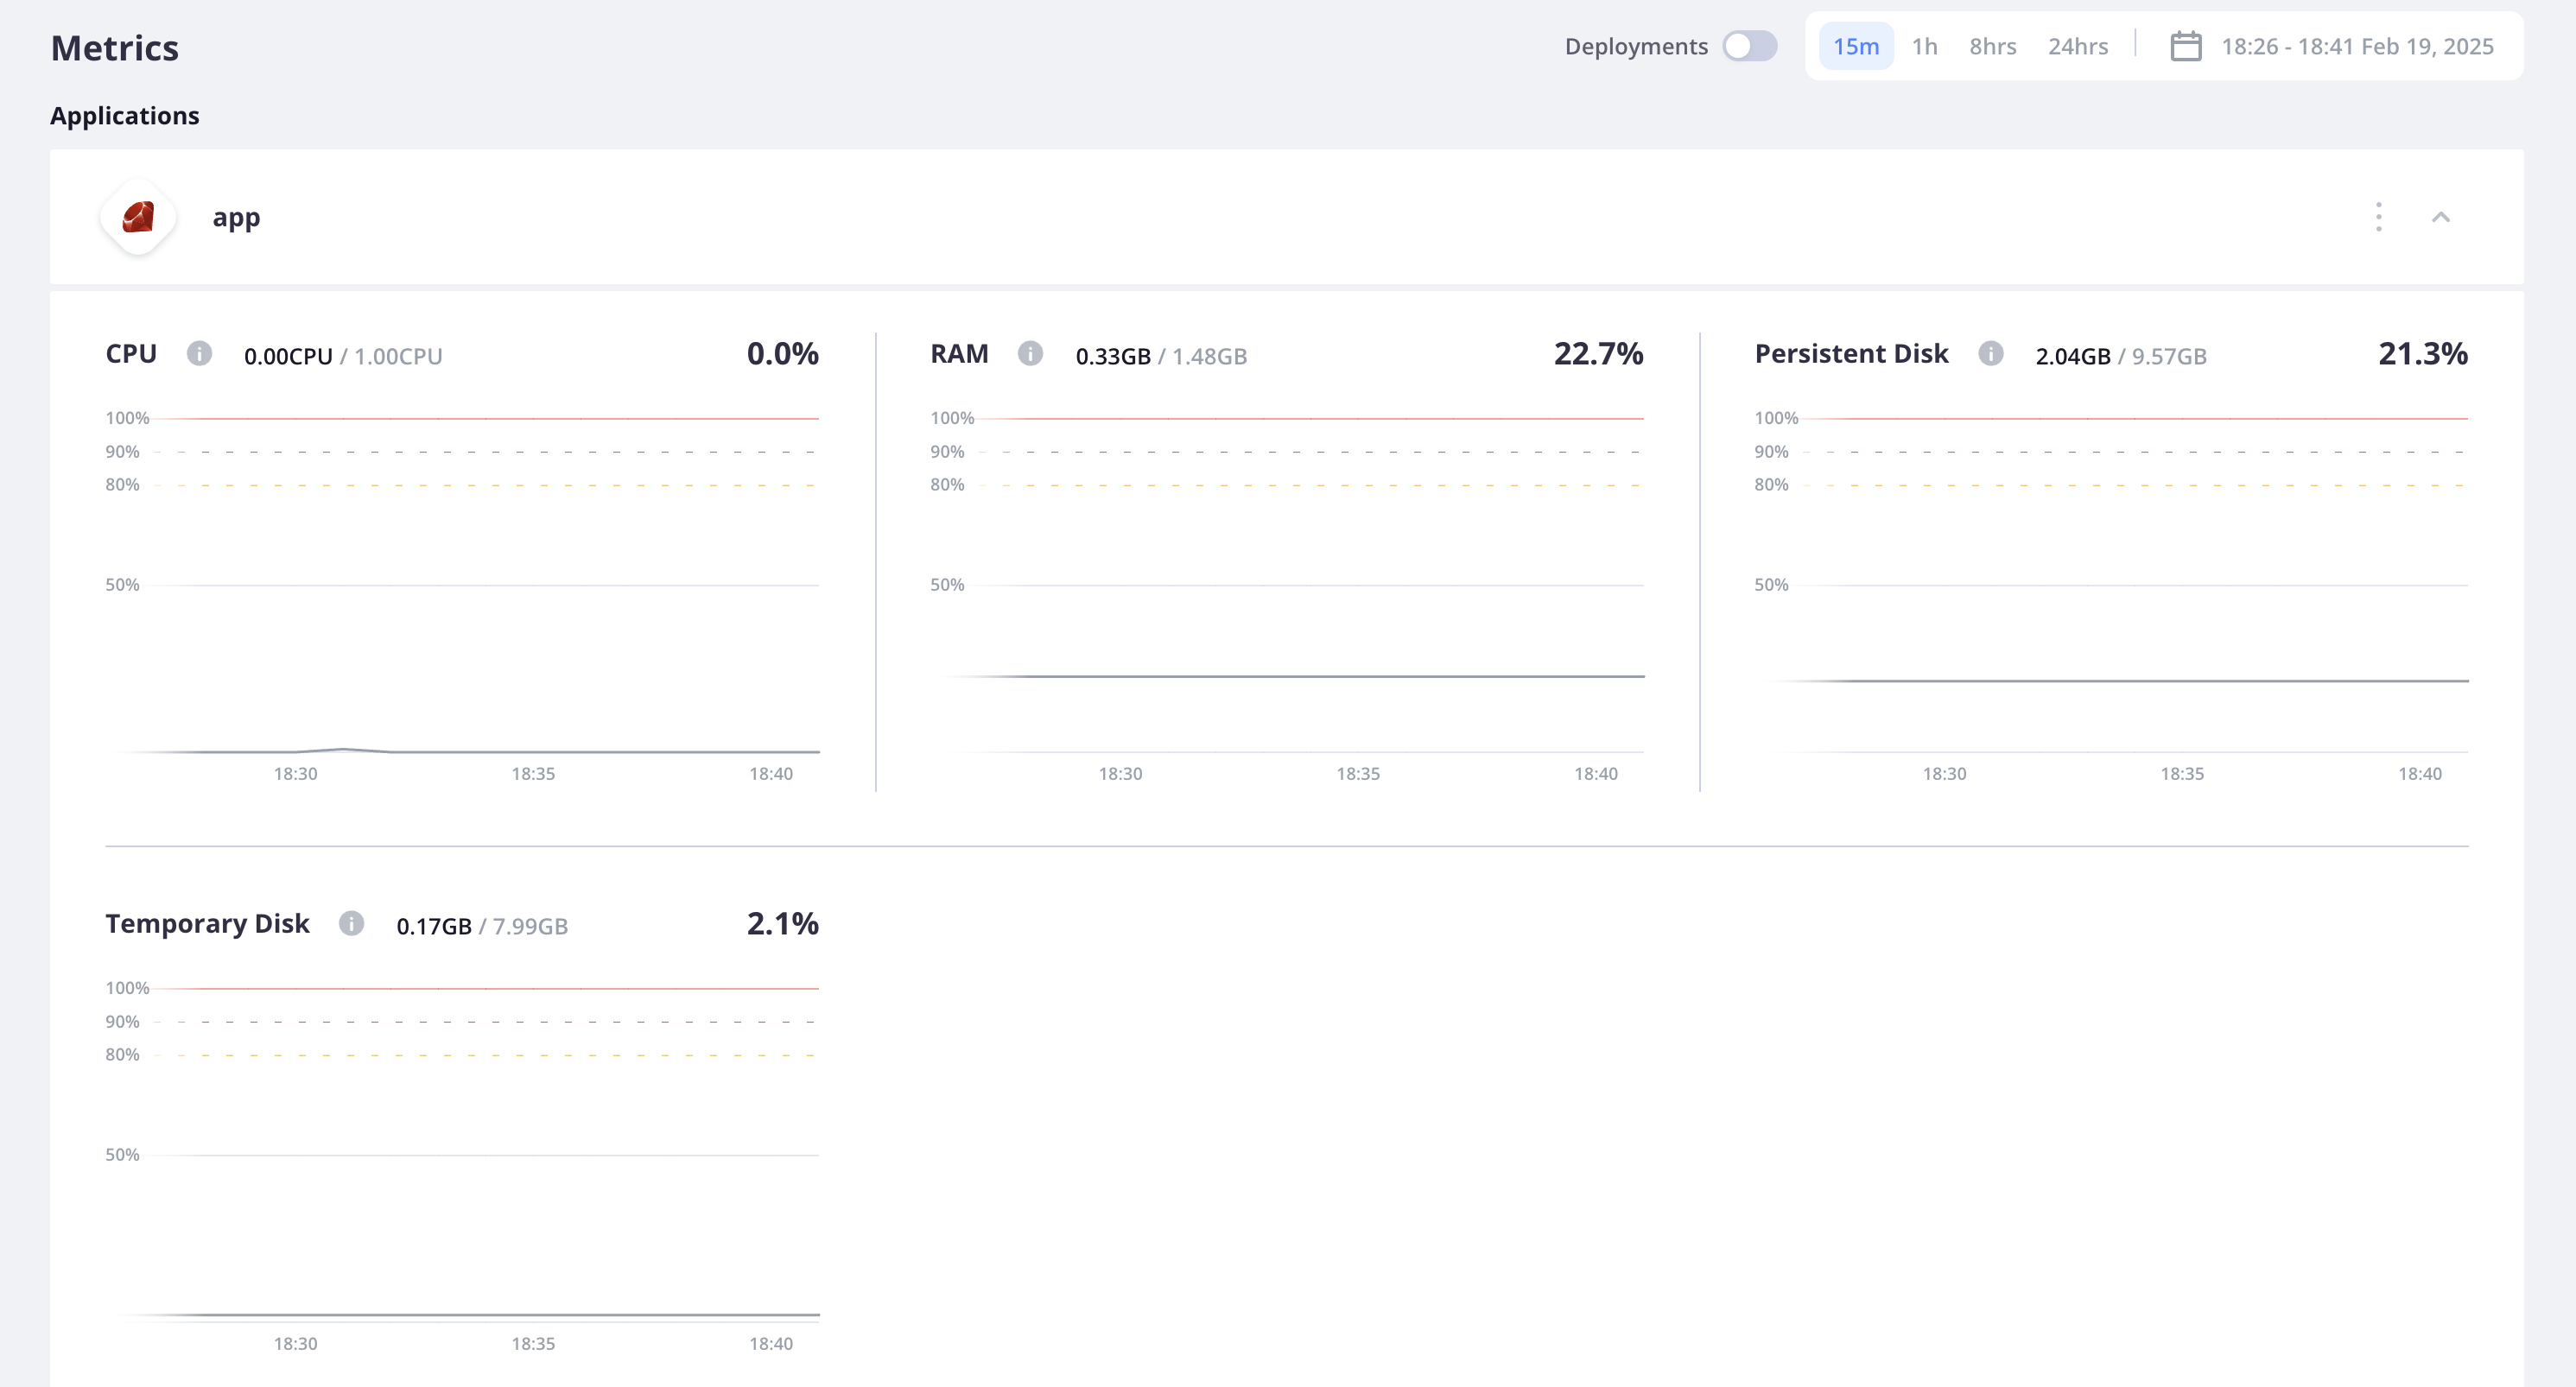
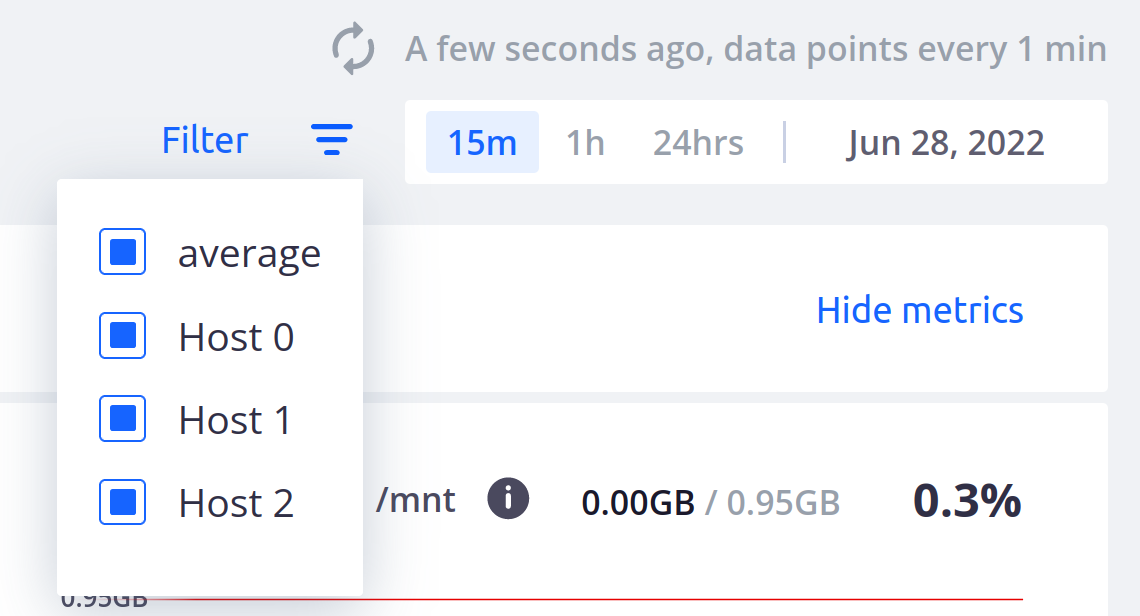
By default, the graphs include all instances and an average over the instances. To select metrics for specific instances, click Filter.
Service containers
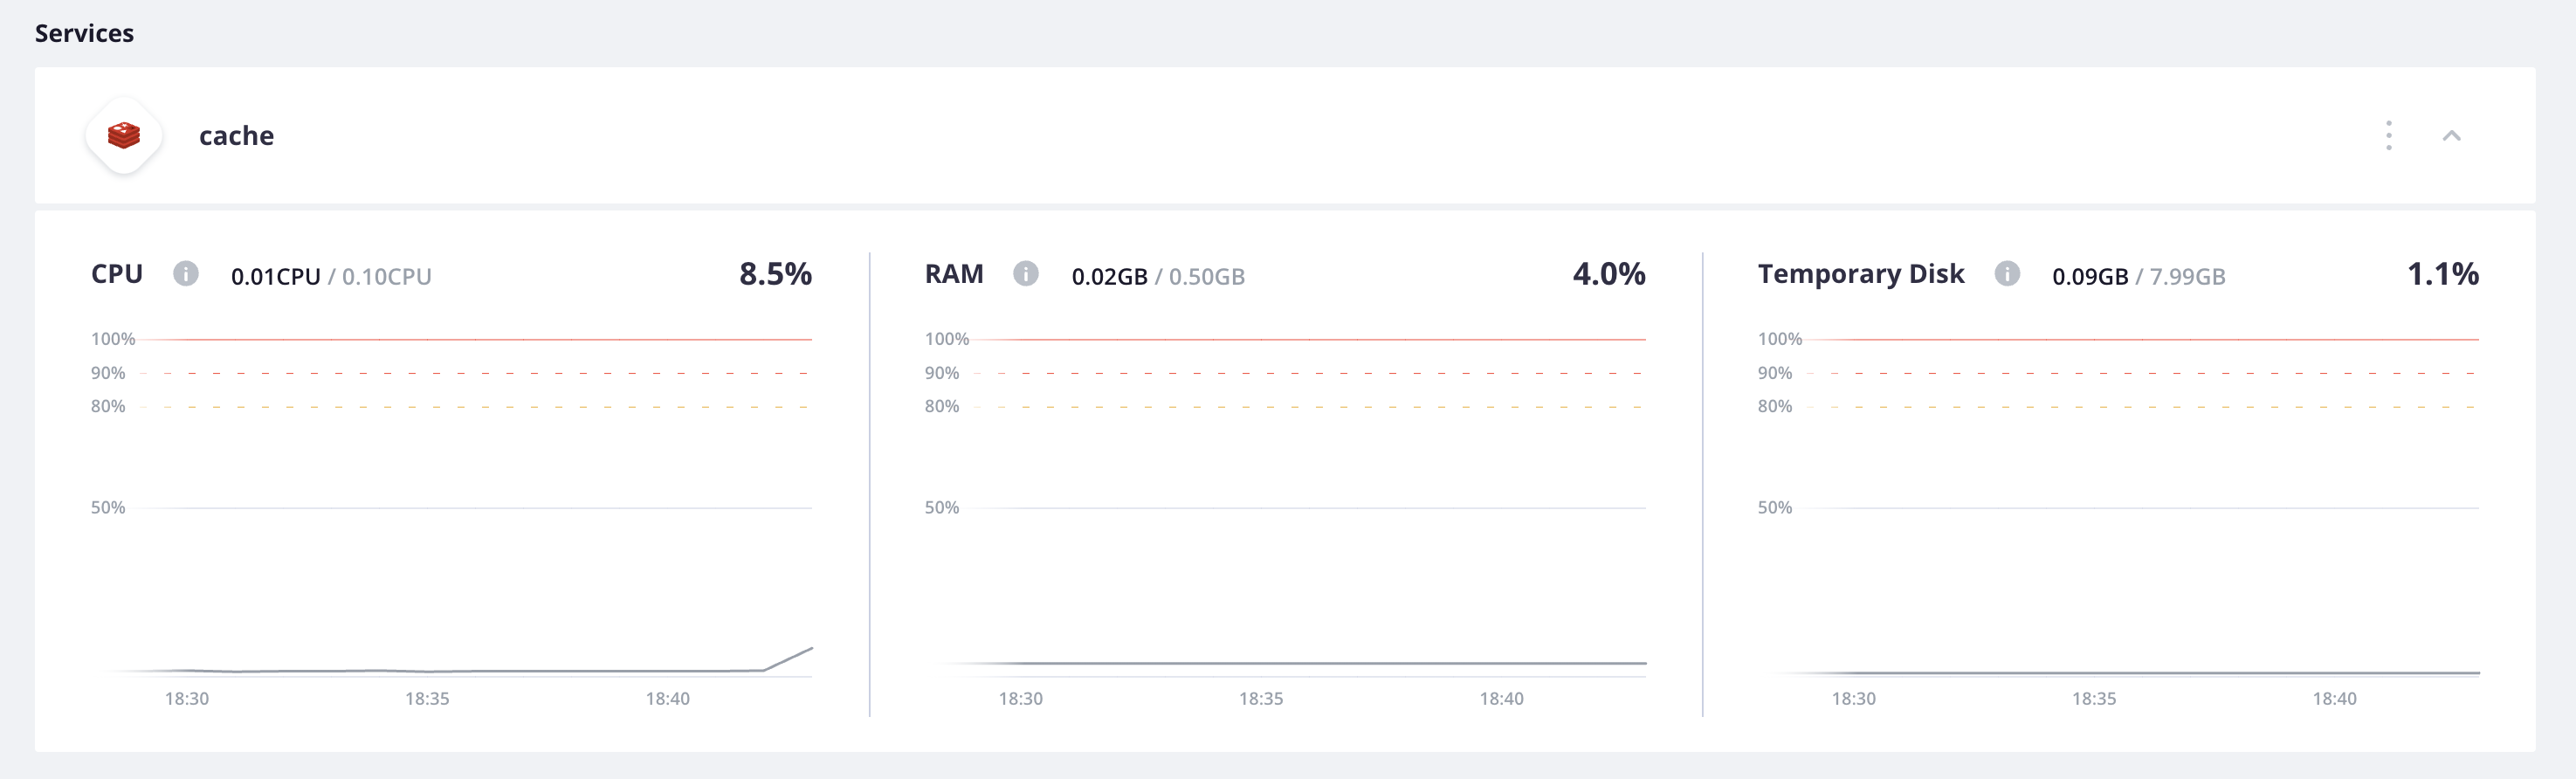
Metrics graphs for the cache service container show CPU, RAM and disk allocation and usage. The temporary disk is 7.99 GB.
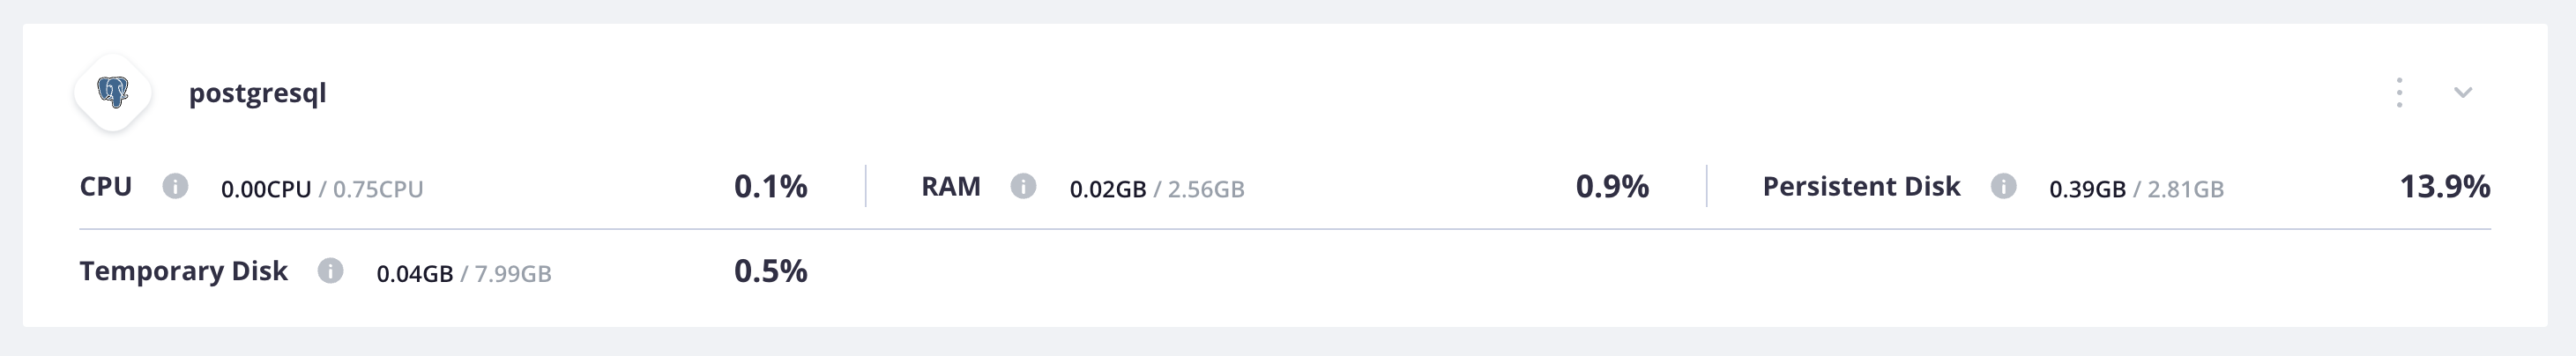
PostgreSQL
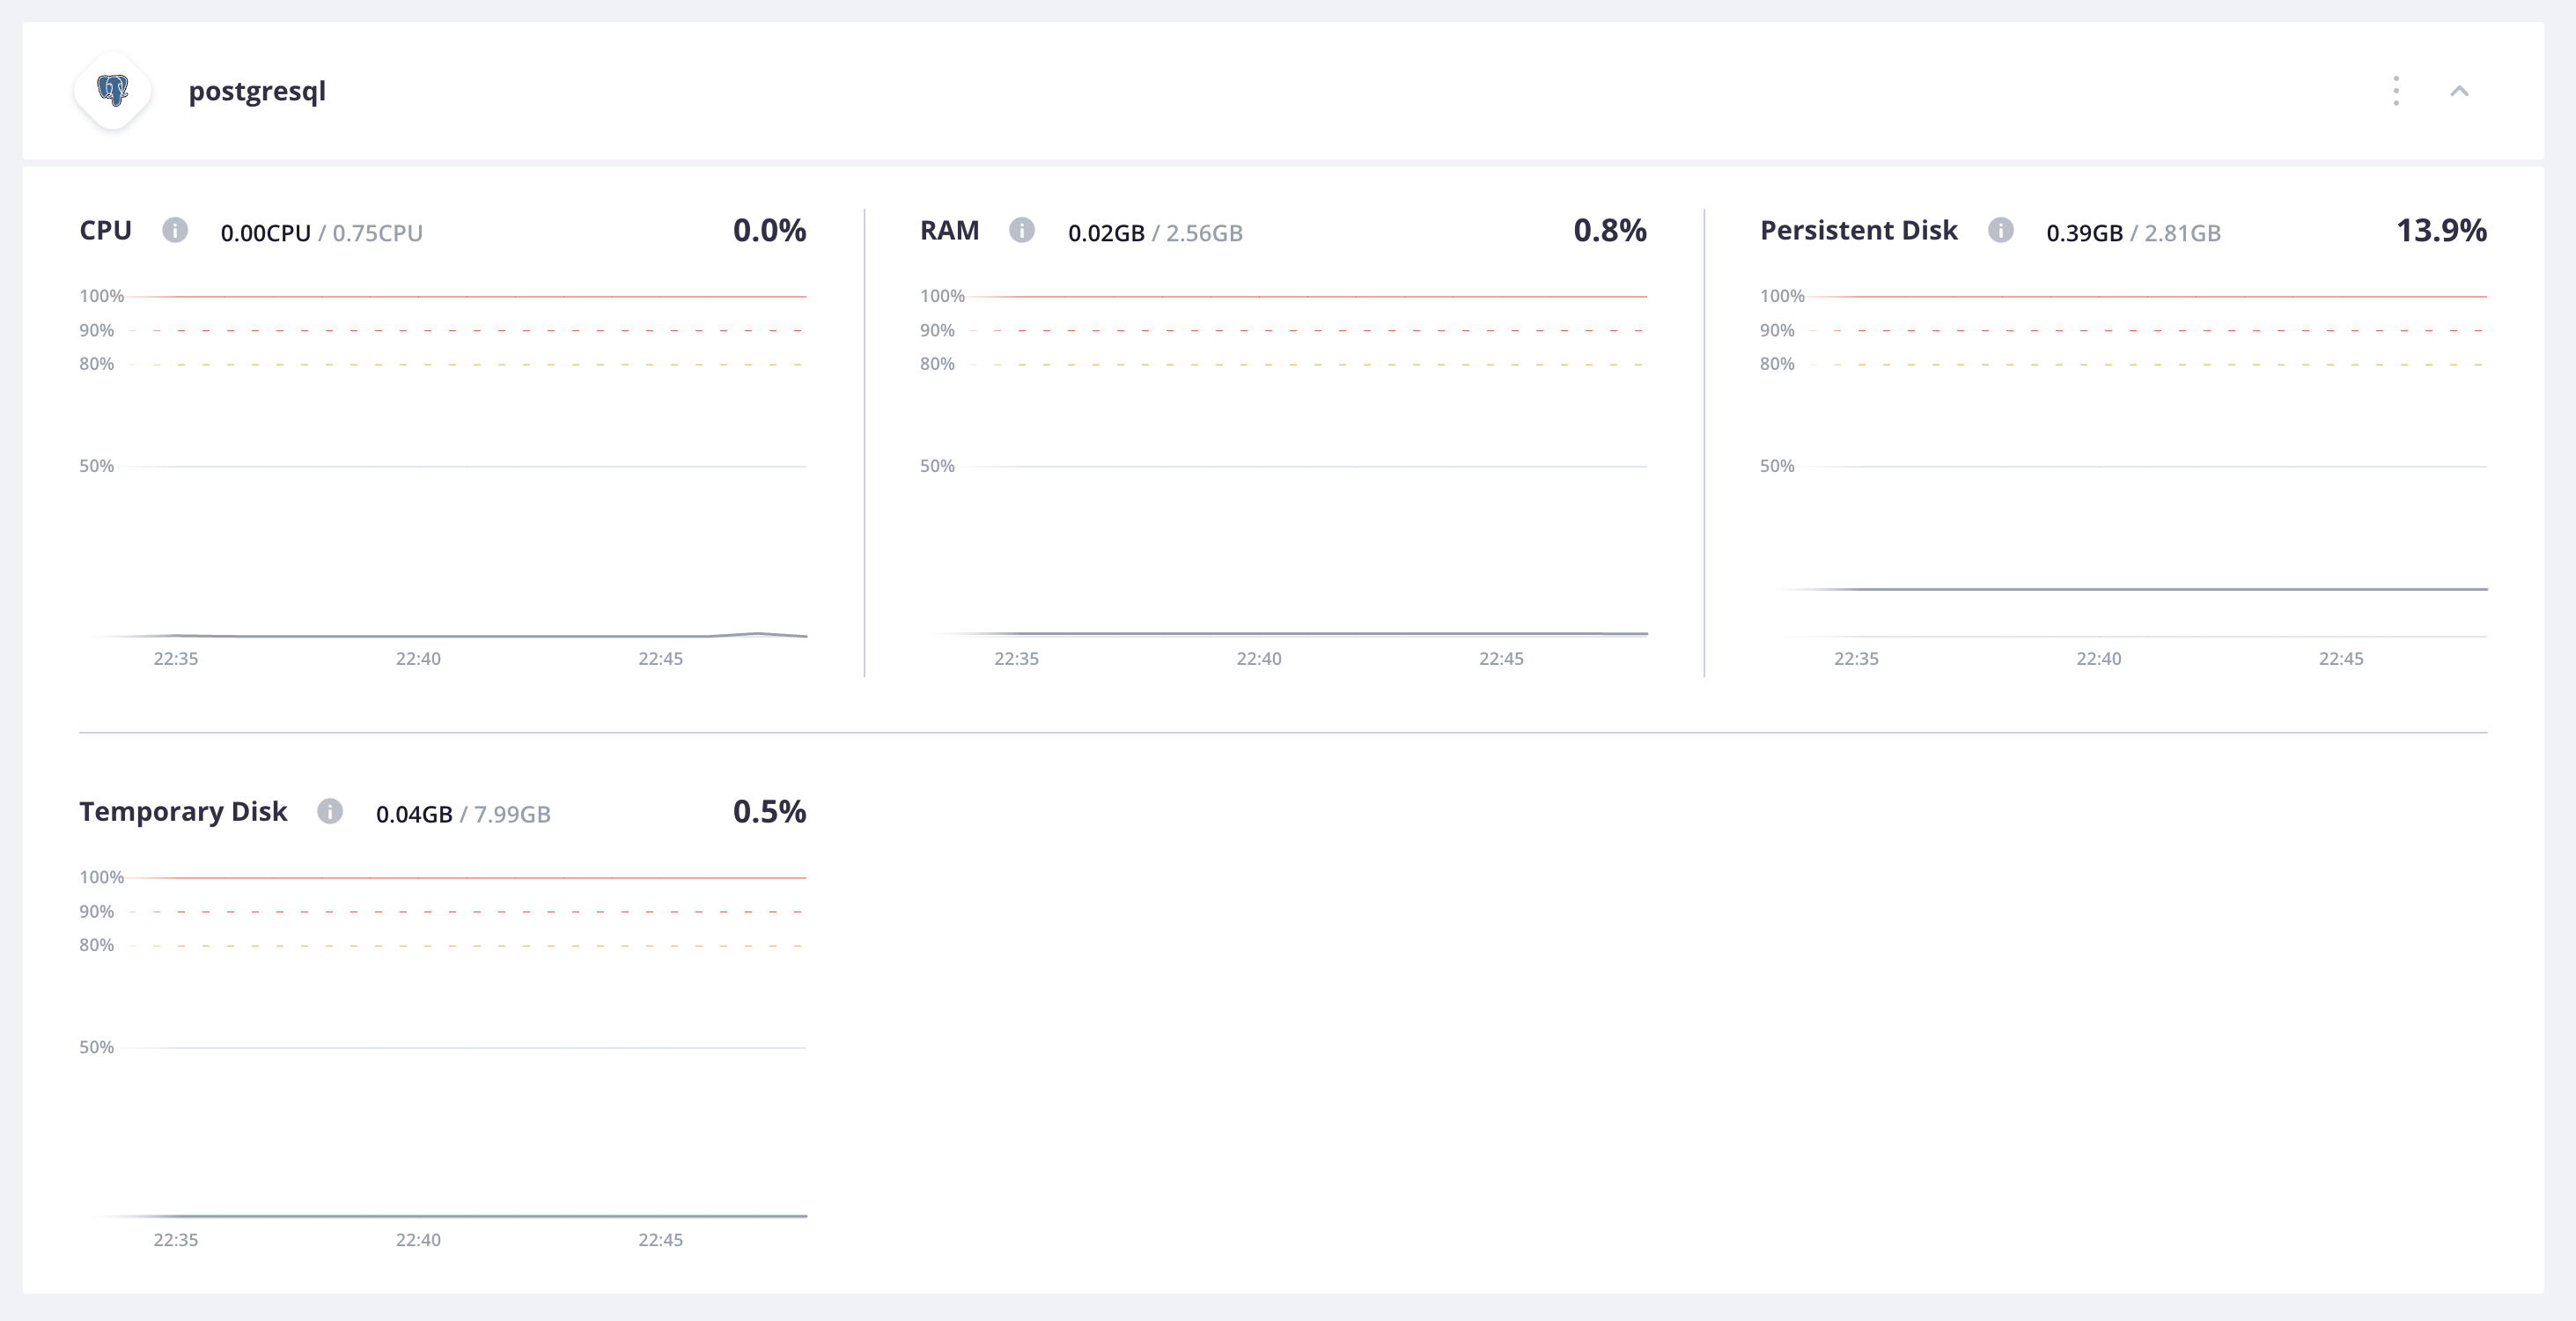
Metrics graphs for the PostgreSQL service container show CPU, RAM, disk allocation and usage. The persistent disk has been configured in the services configuration as 2.81GB, while the temporary disk is 7.99 GB.
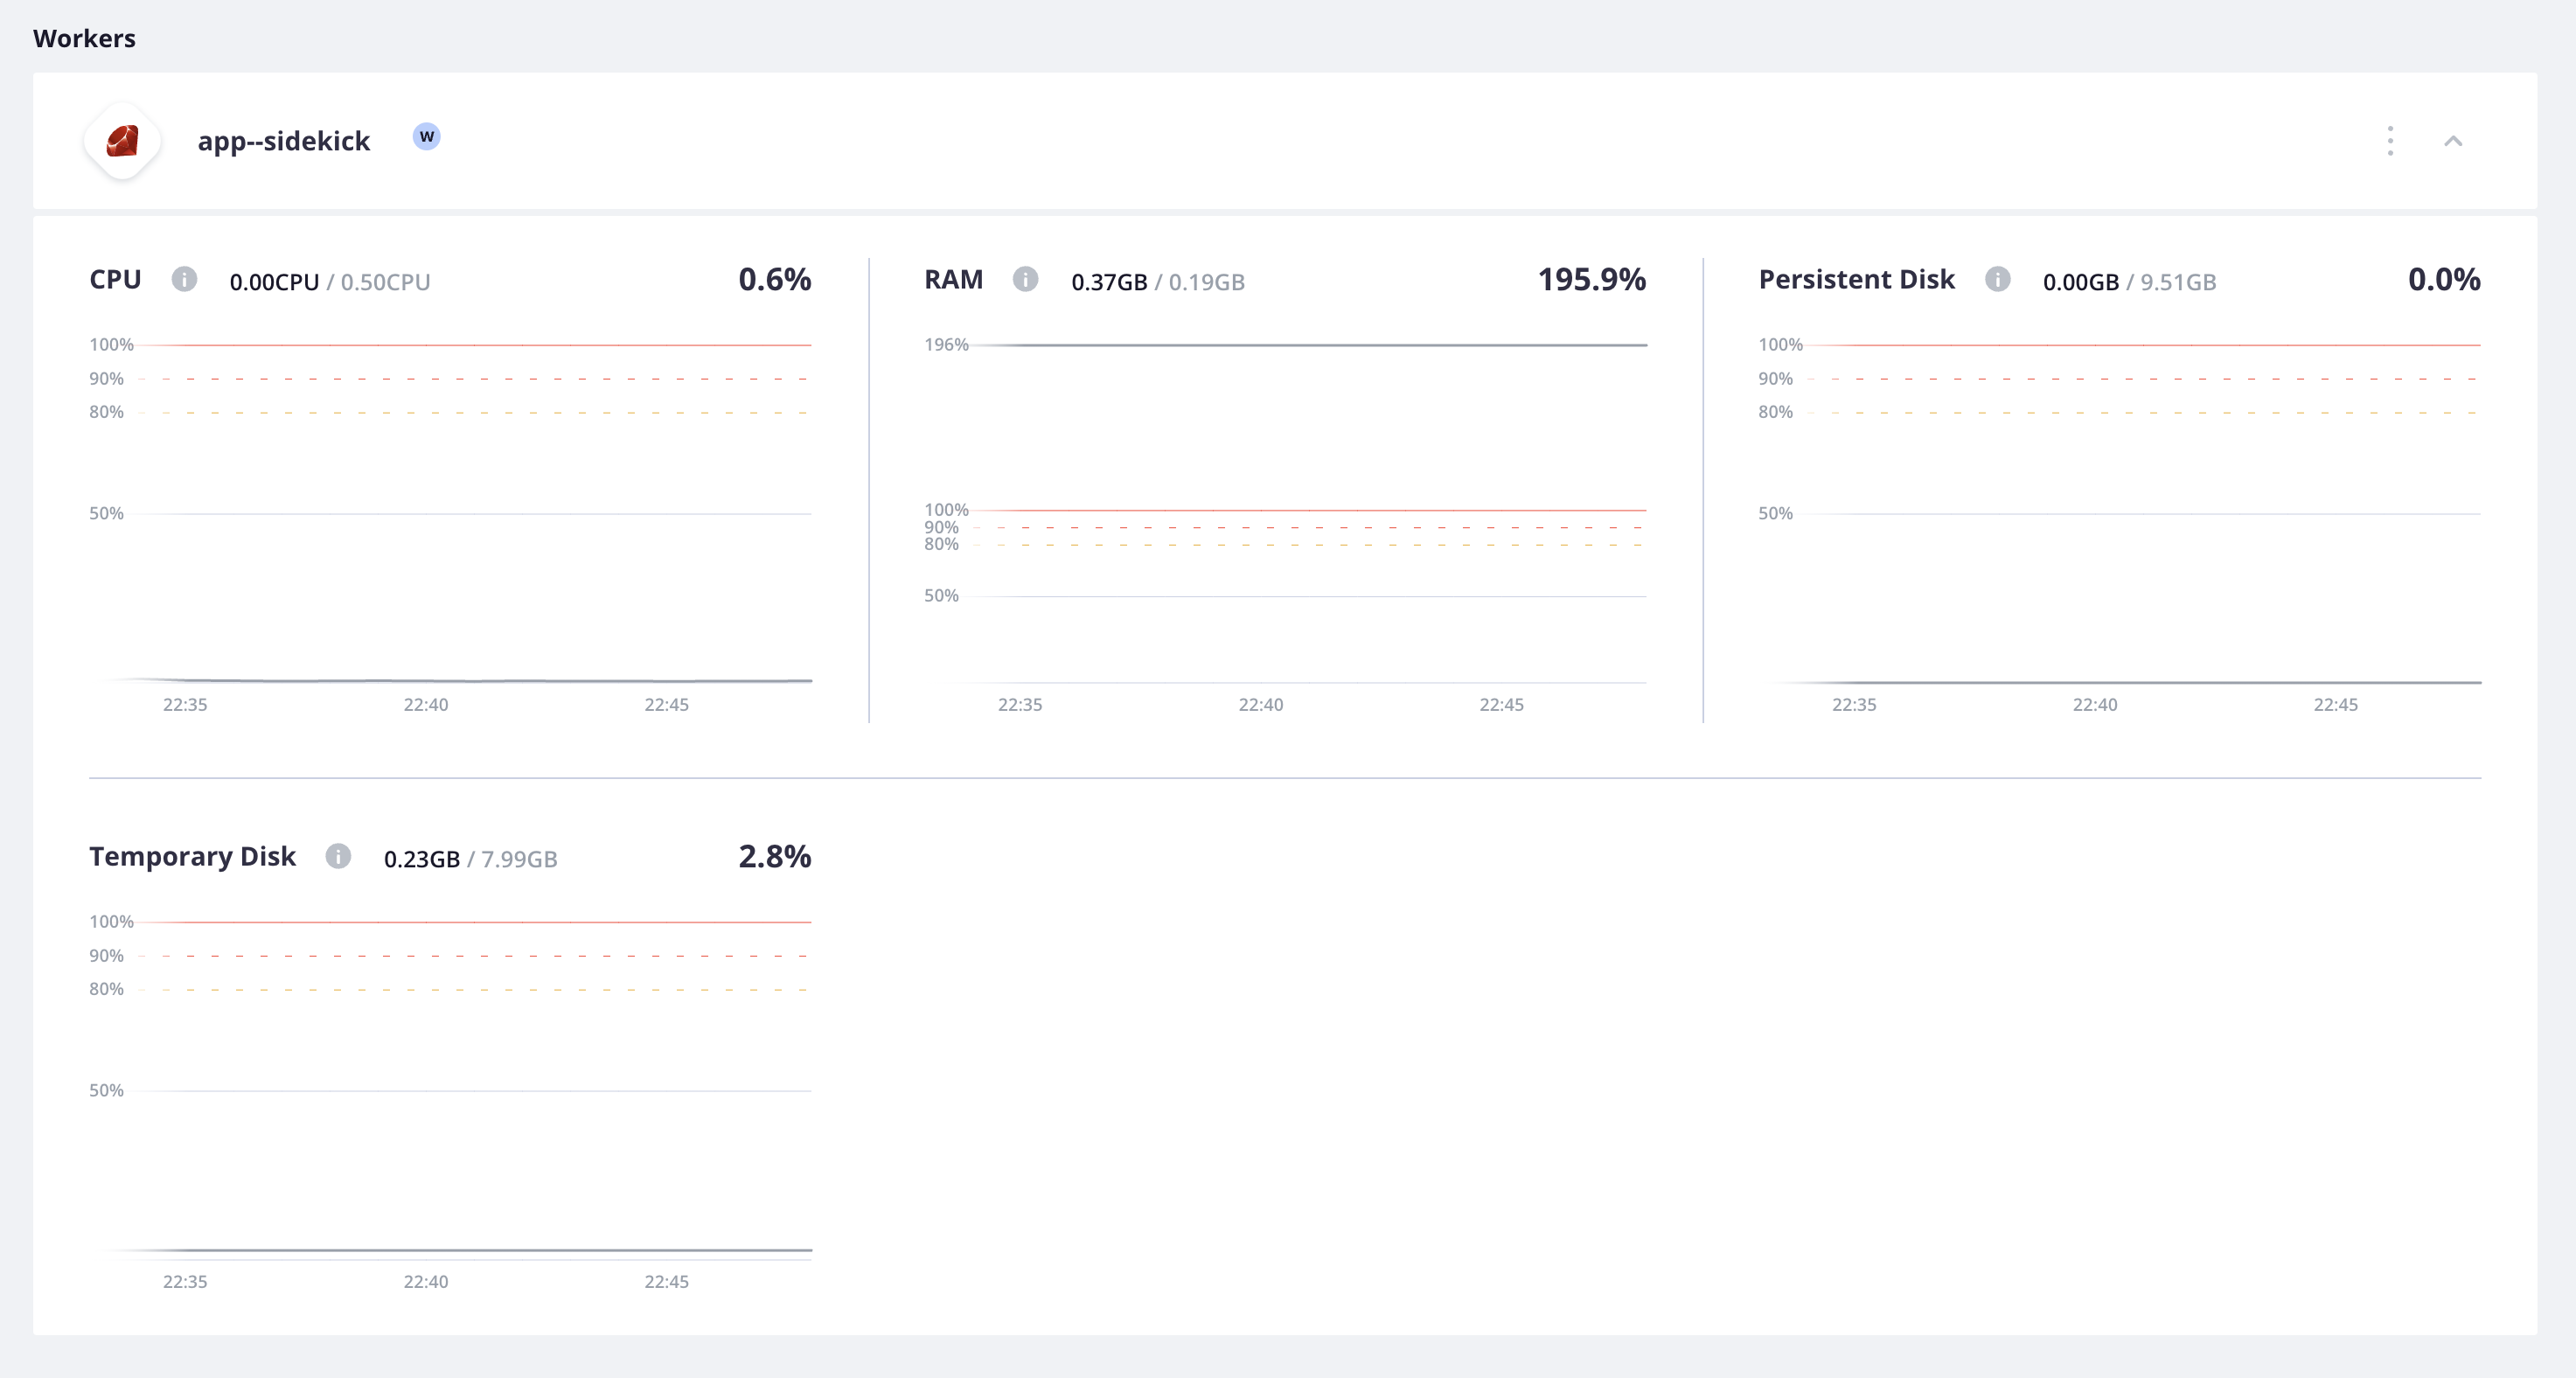
Worker containers
Metrics graphs for the worker container show CPU, RAM, and disk allocation and usage. The persistent disk has been configured in the app configuration at 9.51 GB, while the temporary disk is 7.99 GB.