Infrastructure metrics
Back to home
On this page
Platform.sh projects are accompanied by live infrastructure metrics that provide an overview of resource usage for environments.
Within the Console, metrics can be found for an environment under Metrics.
The information under Metrics shows usage metrics for:
Dedicated Gen 2 environments: each of the three hosts in your N+1 configuration and their average for the Production environment. Metrics aren’t available for other Dedicated Gen 2 environments (such as a staging environment), but are available for Grid environments (such as your preview environments).
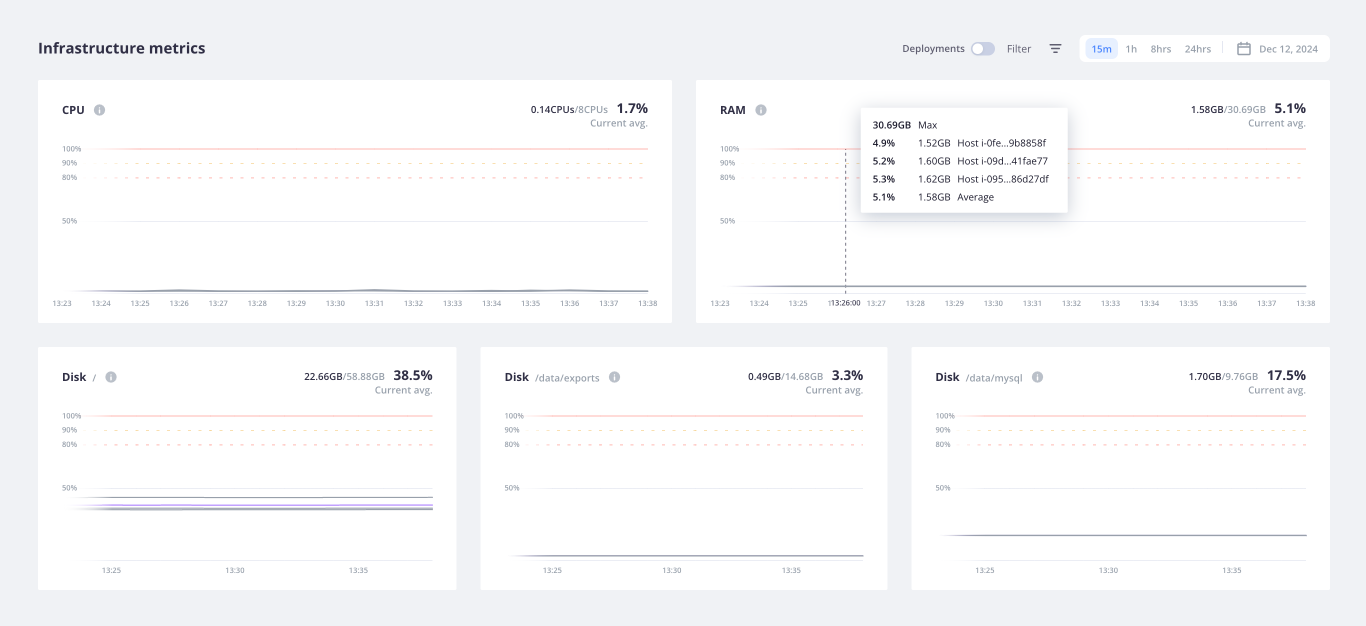
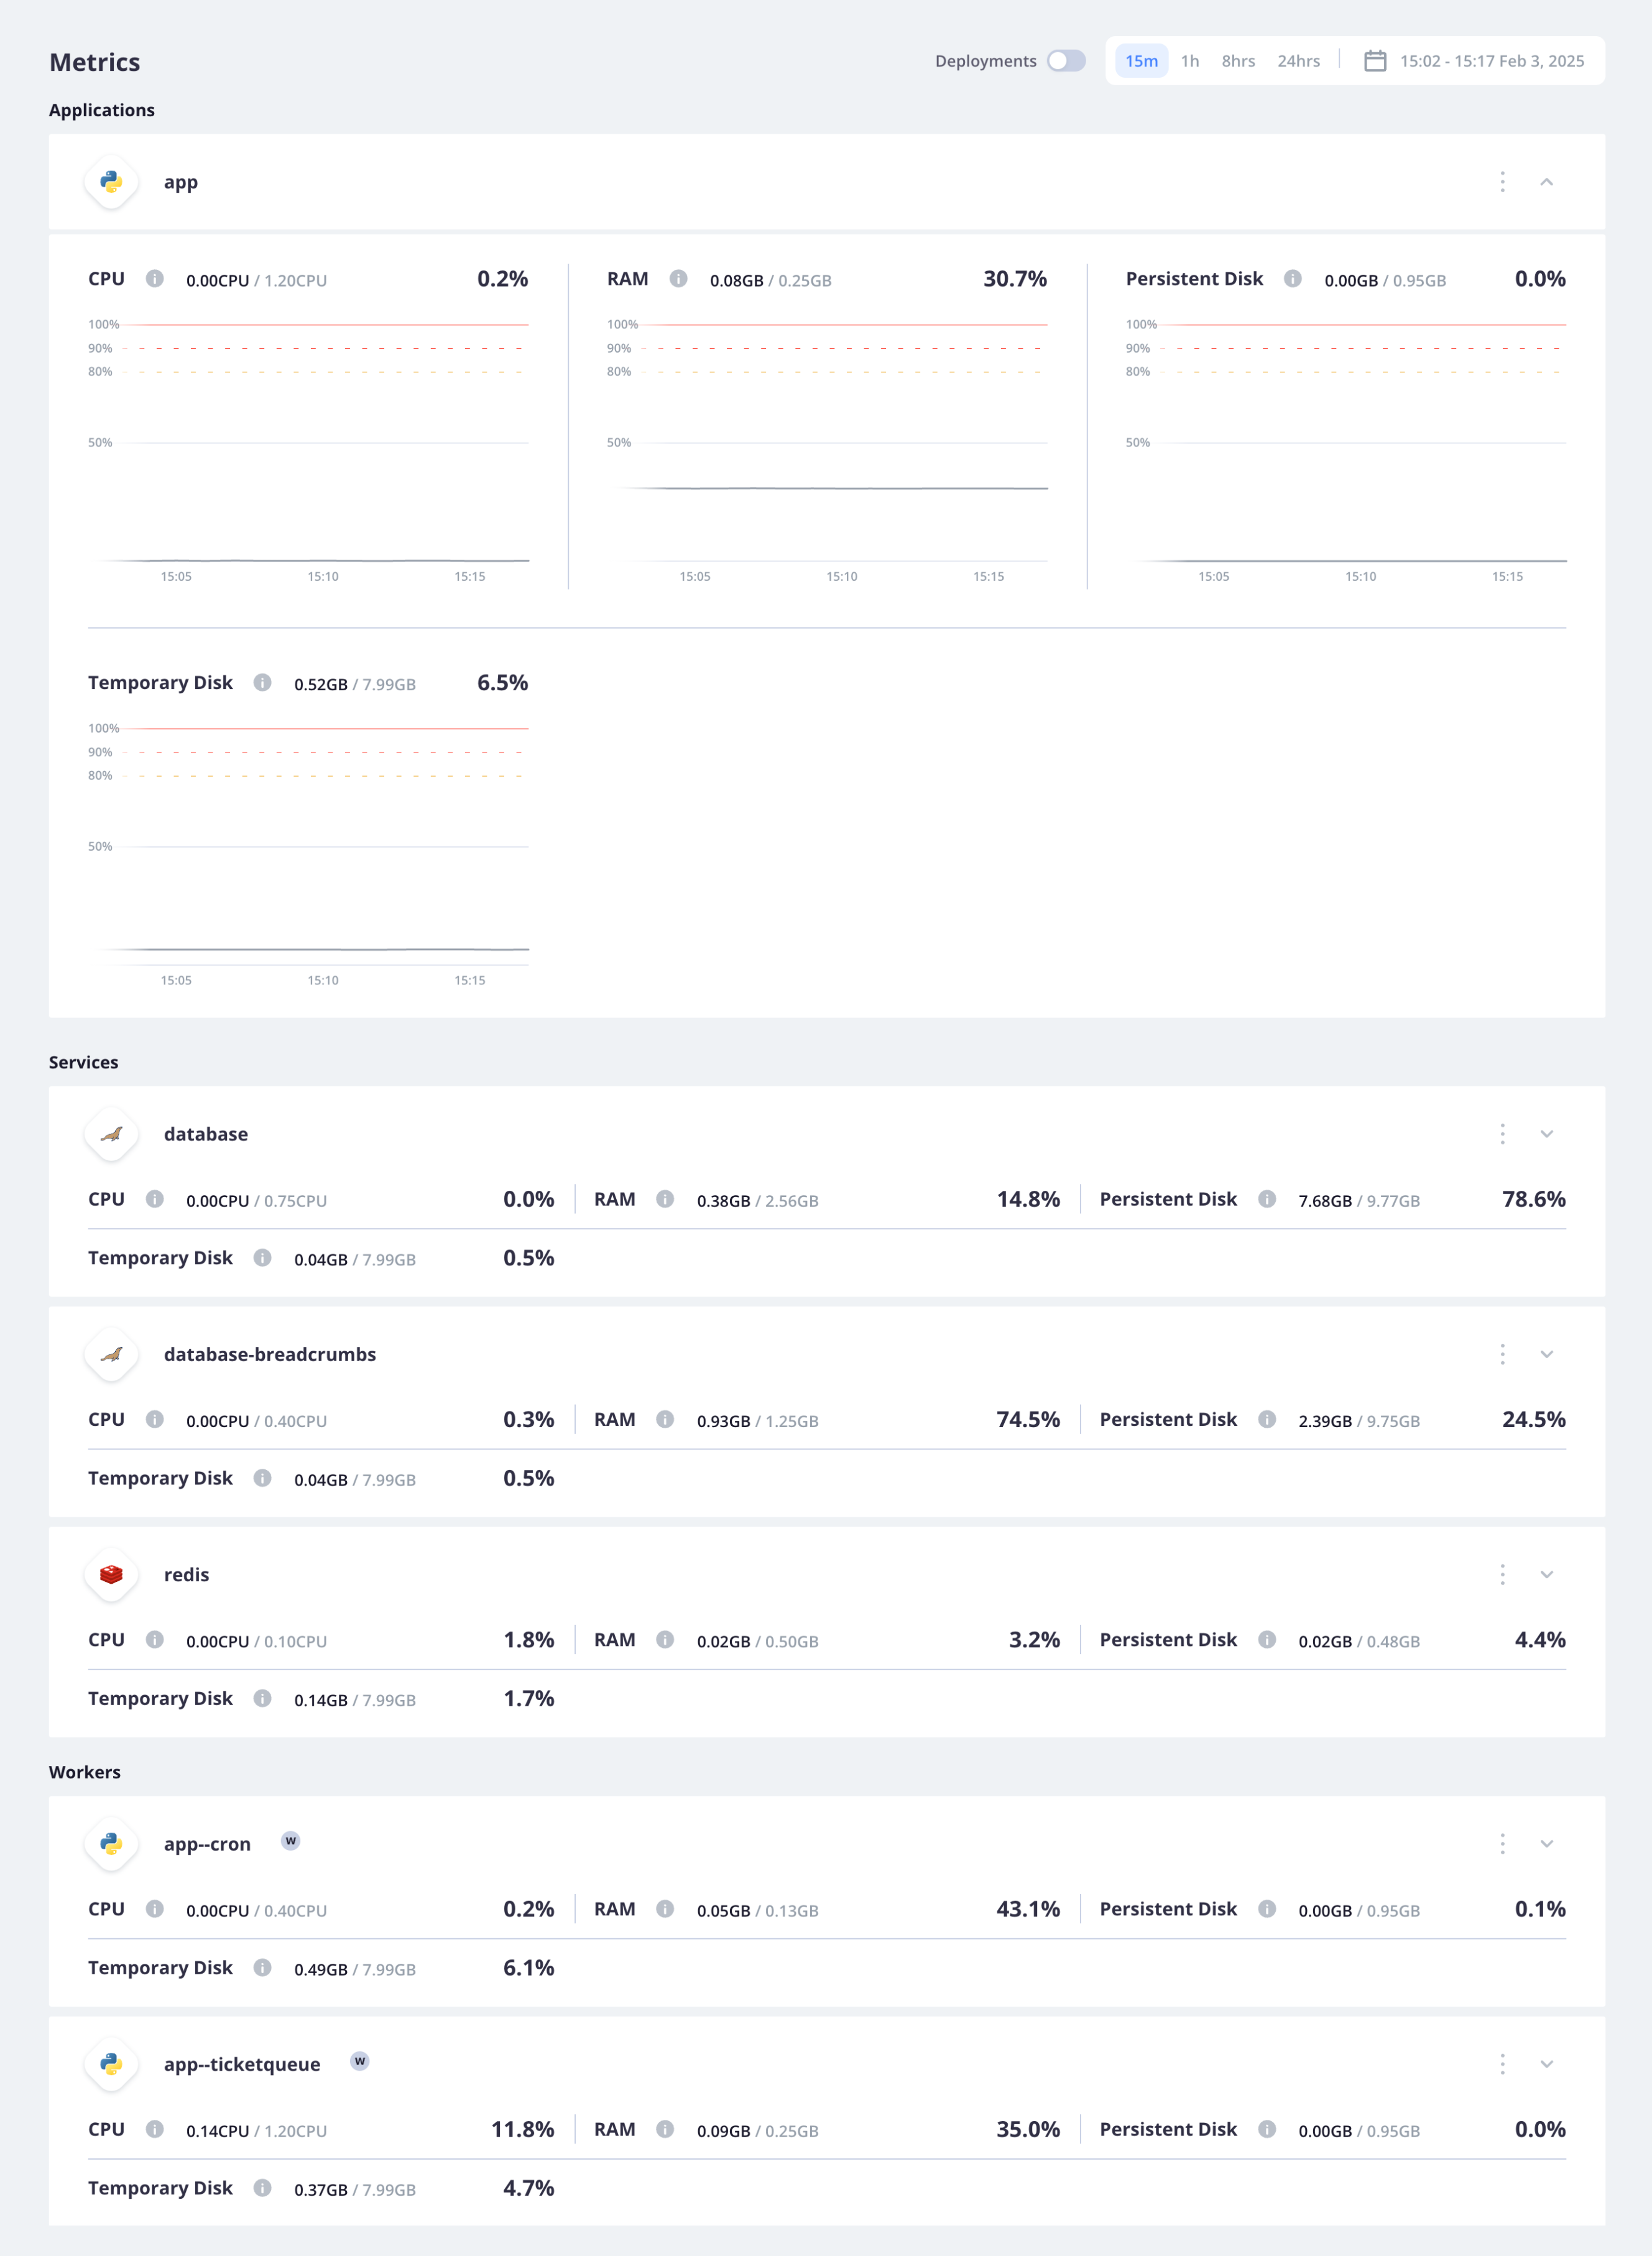
Grid environments: your service, app, and worker containers. These metrics are available for all of your Grid environments.
Default thresholds 
All of the graphs show color-coded lines for the following thresholds:
- Usage up to 100% results.
- Usage that crosses 80% results.
- Usage that crosses 90% results.
- Usage that crosses 50% results.
Recommendations
The default thresholds aim to give you an idea of when your hosts/containers are close to running out of resources. The impact differs based on your specific apps and service.
Dedicated Gen 2 environments
For Dedicated Gen 2 environments, the thresholds are set for each host. If the resources are high and hovering close to the 100% threshold, you might want to consider:
- Optimizing your code (if possible)
- Increasing your plan
Grid environments
For Grid environments, the thresholds are set for each container. If the resources are high and hovering close to the 100% threshold, you might want to consider:
- Optimizing your code (if possible)
- Changing your app size or service size
- Increasing your plan
Time intervals
Measurements are taken for each metric every 1 minute. You can select a time frame over which to see these measurements for the entire Metrics view. In the primary three views, averages are shown over larger intervals.
| View | Time between measurements | Example |
|---|---|---|
| The last 15 minutes (15m) | 1 minute | 10:00, 10:01, 10:02 |
| The last hour (1hr) | 1 minute | 10:00, 10:01, 10:02 |
| The last 24 hours (24hr) for Dedicated and 8 hours (8hr) for Grid | 20 minutes for Dedicated, 10 minutes for Grid | 10:00, 10:20, 10:40, 11:00 |
To zoom in on smaller intervals, select specific ranges in a graph.
The interval between measurements then changes based on the range you choose.
| View | Time between measurements |
|---|---|
| < 2 hours | 1 minute |
| 2 to 5 hours | 5 minutes |
| 5+ hours | 20 minutes |
Longer time intervals
Observability Suite
This feature is available as part of the Observability Suite. To add the Observability Suite to your project and take advantage of this feature, contact Sales.
If you have the Observability Suite, you can access historical data for up to 30 days. These data should help you understand trends over time and whether a given measurement is normal, something that occurs occasionally, or a true anomaly.
To see data over a given time frame, use the date picker to select the range to display.
Deployments
Sometimes deployment activities (pushes, merges, syncs) can influence the underlying infrastructure. You don’t want to confuse a spike caused by a successful deploy with an issue that needs your attention.
To see how deployment activity influences the infrastructure, turn on Deployments on your metrics.
Each deployment activity appears as a line on each graph corresponding to the time the activity finished.
To see information about the deployment activity, hover over the line. To see the build log for a specific deployment activity, click the line.