Git log
Back to home
On this page
Once your app is up and running, you want to monitor it to make sure it stays that way. Take advantage of the observability of apps running on Platform.sh to see everything that’s happening.
Check activities 
All events that change your environments are logged as activities. See a list of all activities by running the following command:
platform activitiesYou get a table with all activities that have run or are running.
The most recent one at the top of the table is probably your merge of the dev branch into main.
To see all the details of that activity, copy its ID from the table.
Then use the ID in place of <ID> in the following command:
platform activity:get <ID>This returns the build log from the merge activity. This way, you can keep track of everything that happens in your project.
View logs
Another way to keep track of your project and troubleshoot any issues is to view its logs. Different types of logs are available, such as error logs and any logs your app creates.
To see the access log, a list of all attempts to access your website, run the following command:
platform log accessIf you visited your site to test it, you see your visit here. Otherwise, get its URL by running this command:
platform environment:urlOpen the website in a browser and then run platform log access again.
You now see your visit.
For an interactive prompt with all available logs, run platform log.
Monitor metrics
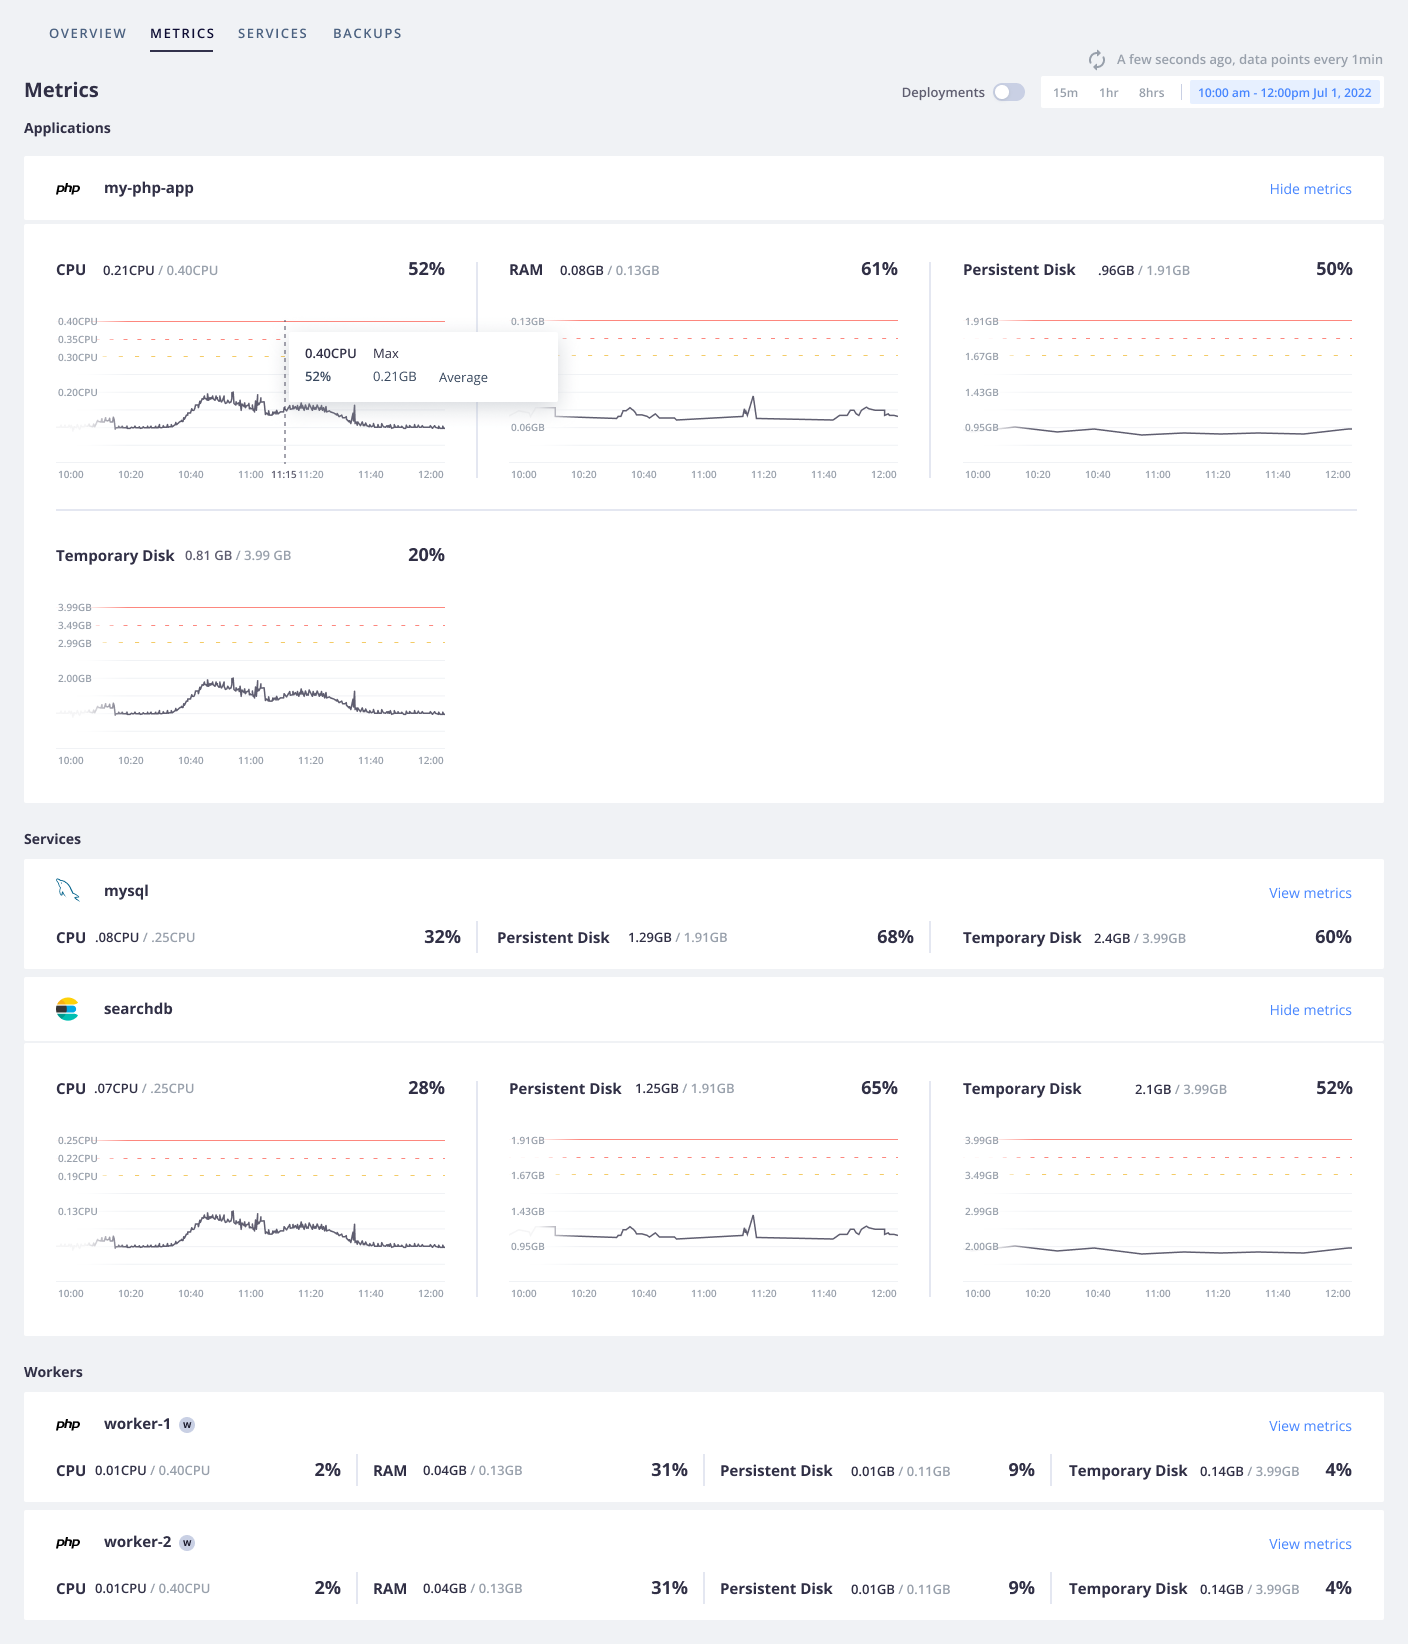
In addition to keeping track of events, you might want to see how your infrastructure responds to these events. For that, your project offers infrastructure metrics where you can see your CPU, RAM, and disk usage.
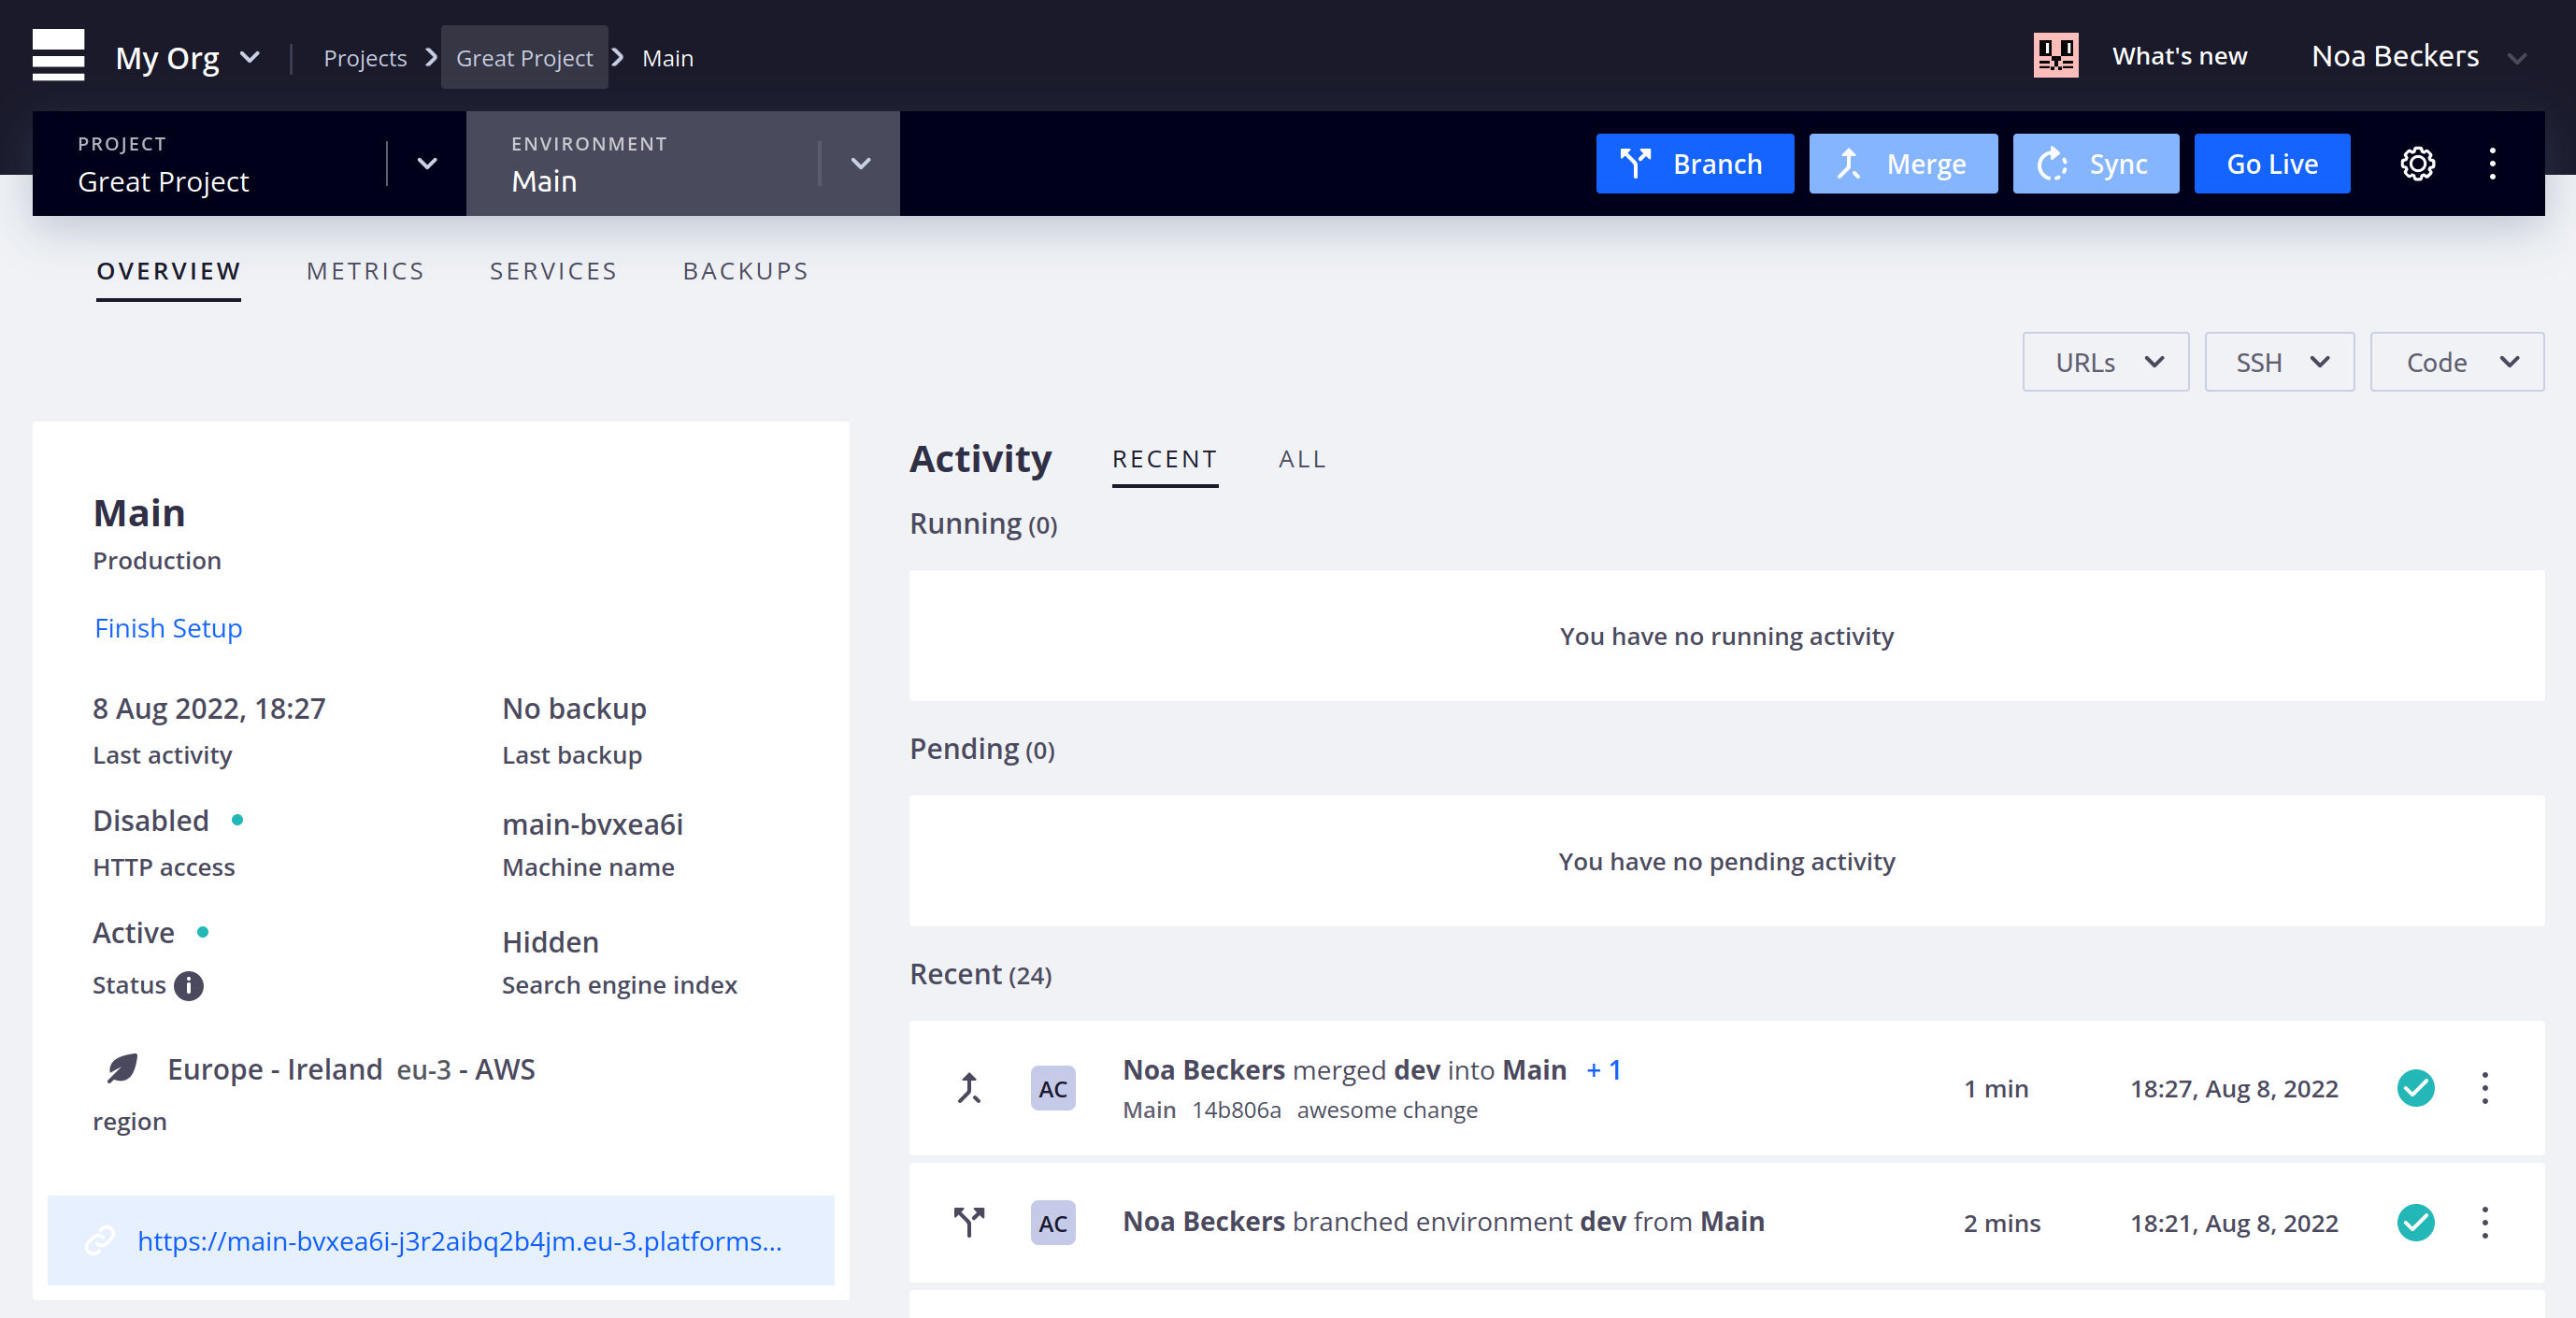
These metrics are available in the Platform.sh Console, which is a web interface that offers similar options for interacting with your project as the CLI.
Open the Console by running this command:
platform webThis opens your project in the current environment.
You can change environments using the --environment flag.
You see information about your project as well as a list of activities,
which should be the same as what you saw by running platform activities.
To see metrics, open the Metrics tab. You see your CPU, RAM, and disk usage over the past 15 minutes, with options for changing the time frame.
Now you know where to go to get information on your app’s performance. Activities, logs, and metrics are useful for keeping track of changes and investigating issues.
But to stay on top of everything, you want to be notified wherever you are. Continue to find out how.