Monitor Dedicated Gen 2 metrics
Back to home
On this page
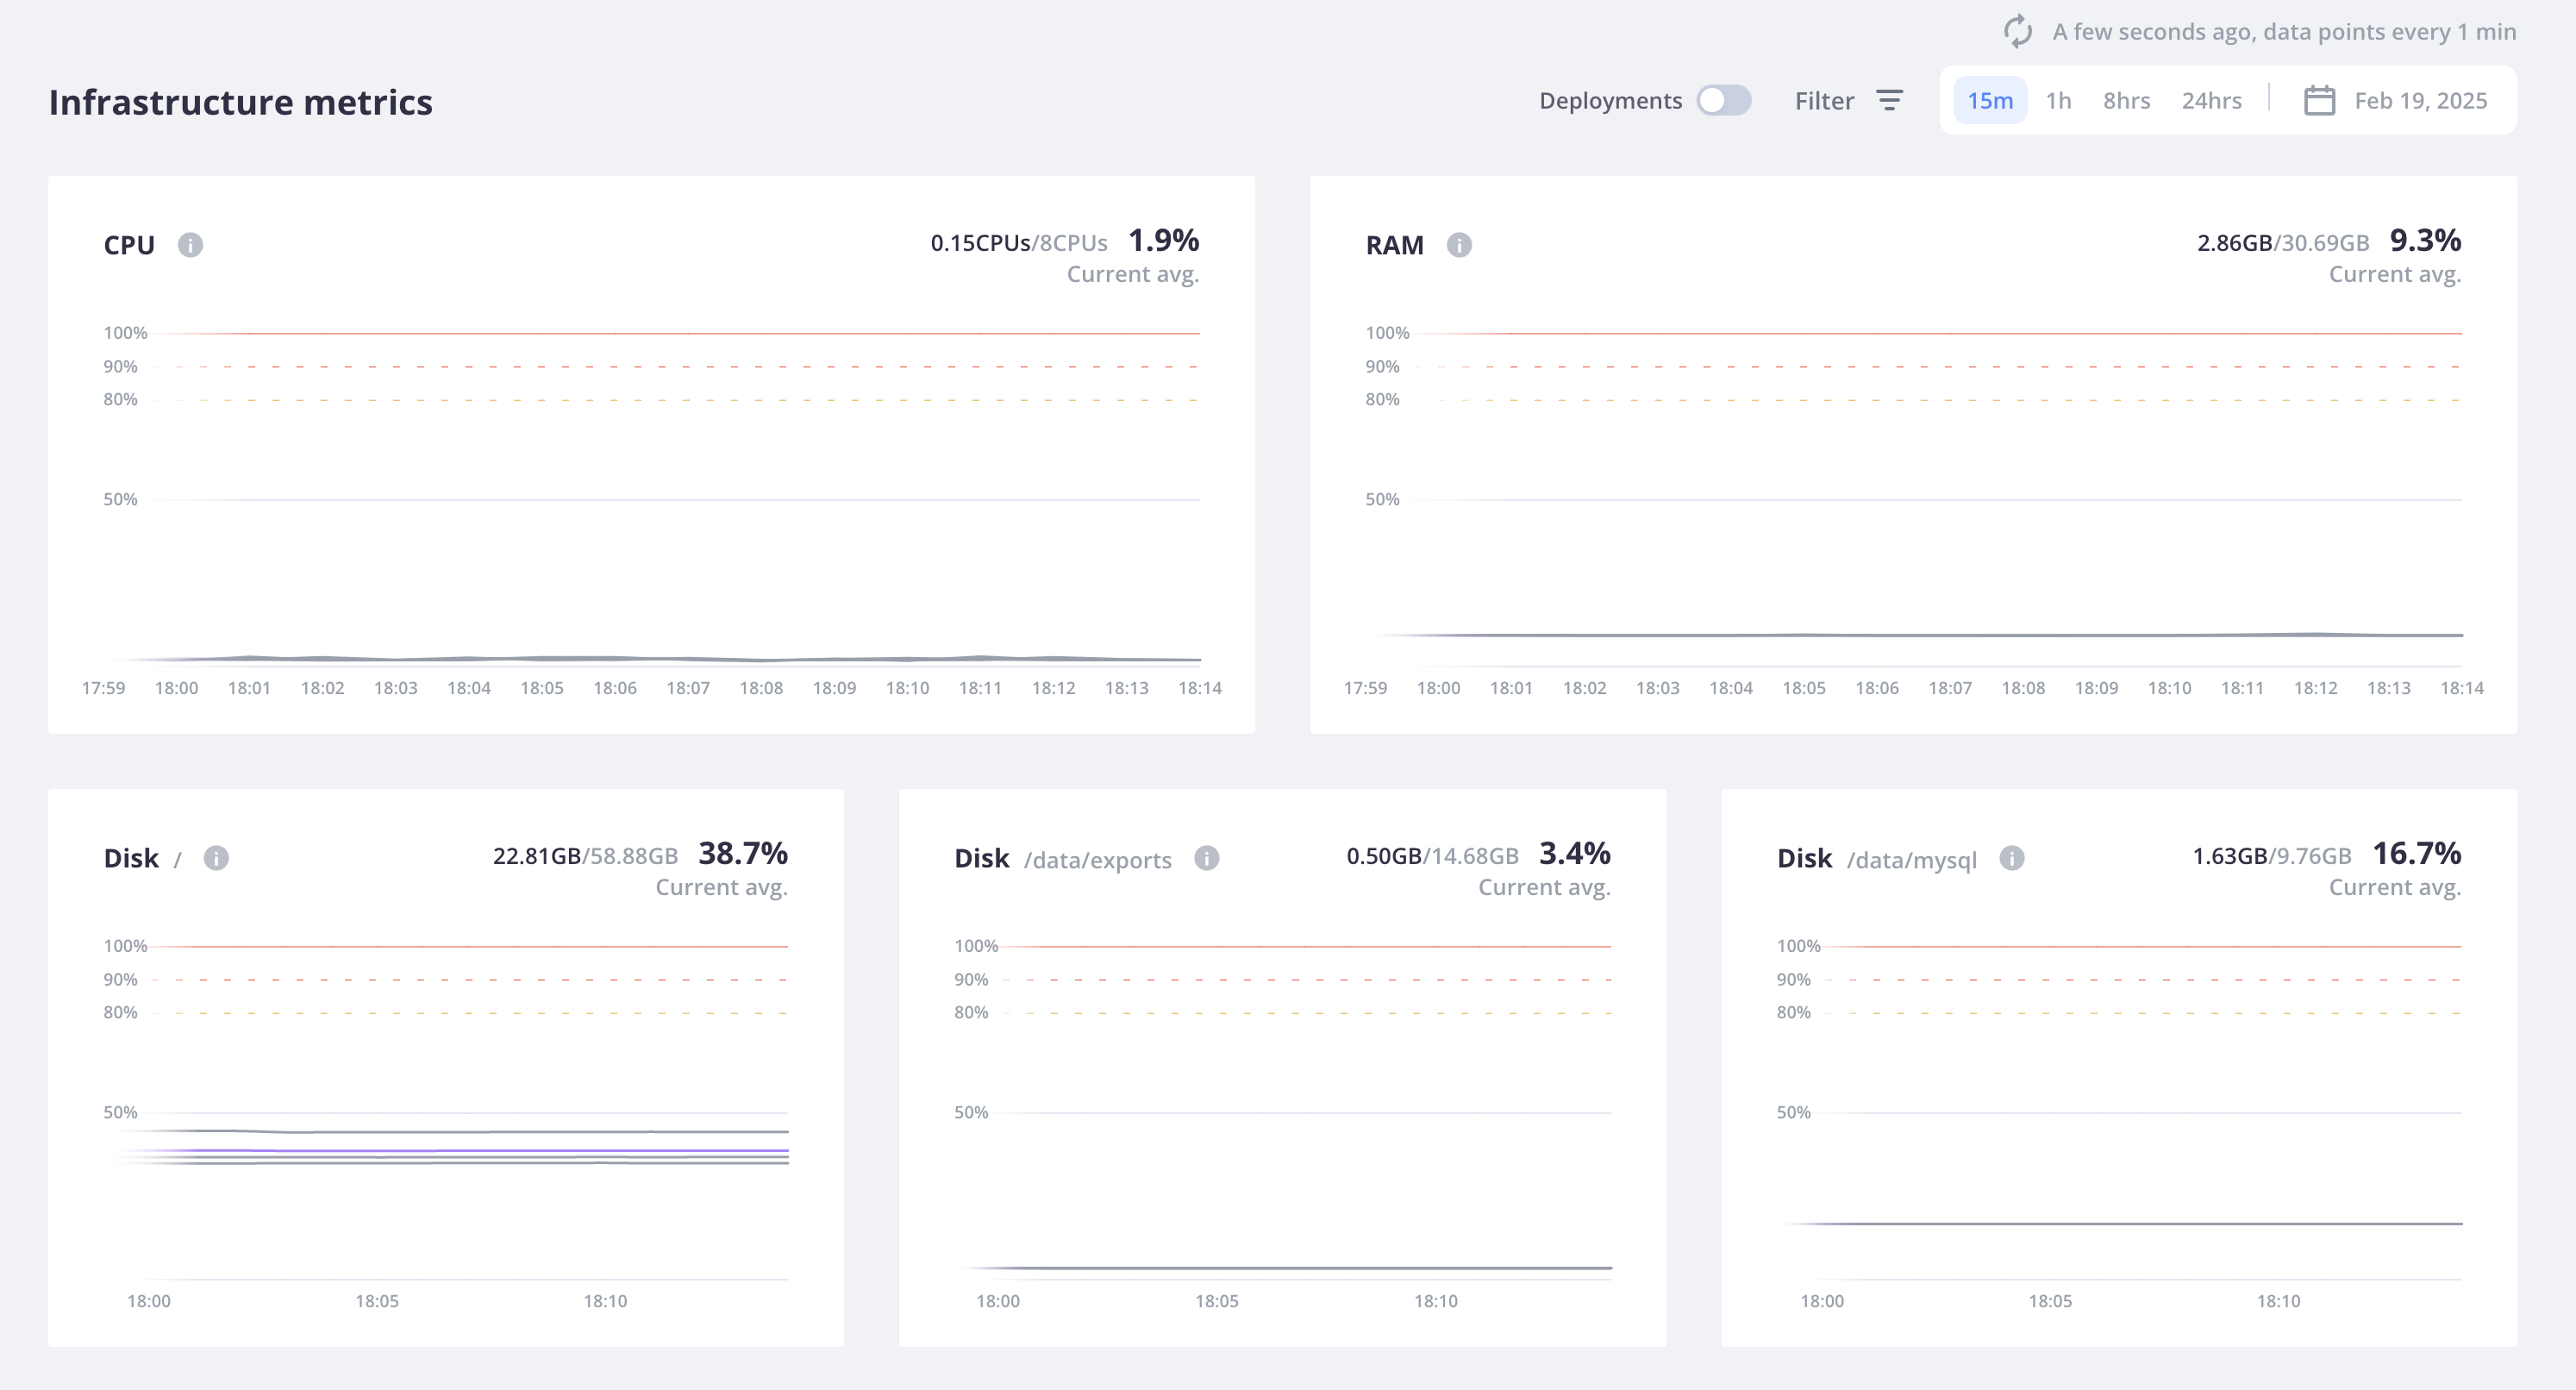
For Dedicated Gen 2 environments, infrastructure metrics report CPU, RAM, and disk space per host and mount point. The graphs differ when the environment has multiple clusters.
Metrics are available for Production environments and Grid environments (such as your preview environments). They aren’t available for other Dedicated Gen 2 environments (such as a staging environment).
By default, the graphs include all hosts and an average over the hosts. To select metrics for specific hosts, click Filter.
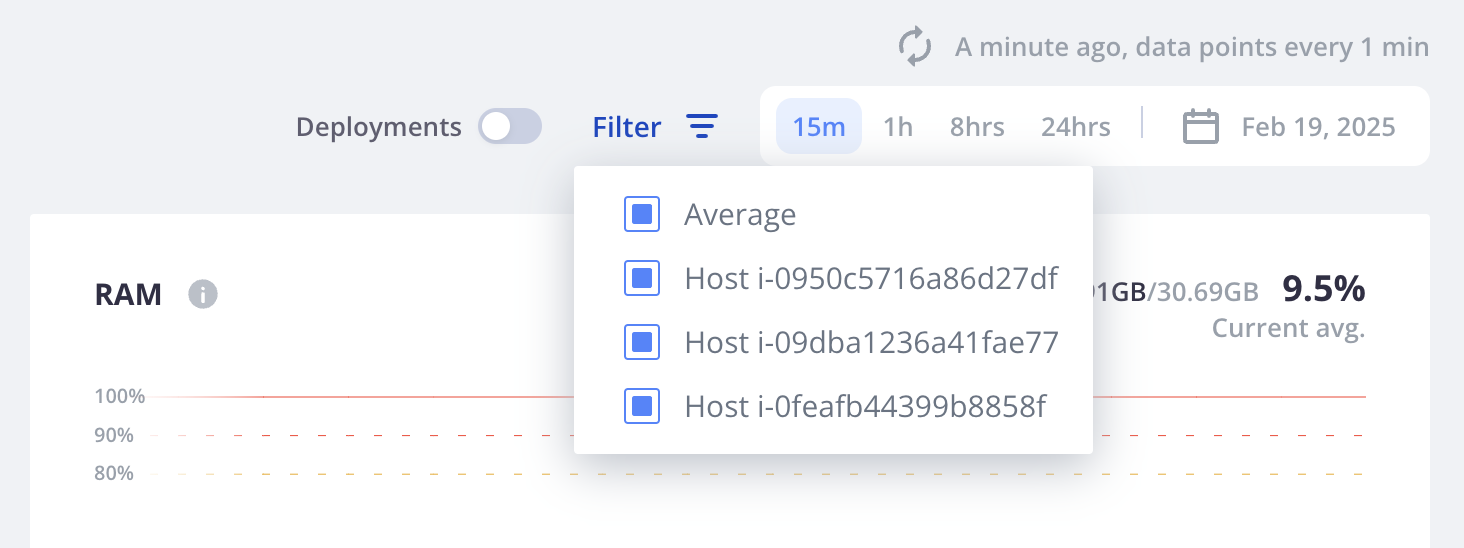
Host IDs 
The IDs for the hosts in a list for metrics filtering will not match the IDs for interacting with a host, such as for accessing the environment using SSH. For example:
| Host ID under Metrics | SSH connection string under Overview |
|---|---|
Host i-04353f1e6f |
ssh 3.ent-abcde3clusterID-production-qwerty8@ssh.us-4.platform.sh |
Host i-04d1ac8319 |
ssh 2.ent-abcde3clusterID-production-qwerty8@ssh.us-4.platform.sh |
Host i-0b1e1b96cf |
ssh 1.ent-abcde3clusterID-production-qwerty8@ssh.us-4.platform.sh |
To get the host ID from an SSH connection, SSH into the host:
ssh 3.ent-abcde3clusterID-production-qwerty8@ssh.us-4.platform.shYou get output similar to the following:
 Welcome to Platform.sh.

 This is environment production-qwerty8 of project abcde3clusterID.

abcde3clusterID@i-04d1ac8319f6ab9a6:~$
The relevant string for the host ID is shown after the @ and before the 7-character string at the end (f6ab9a6).
In this example, the ID is: i-04d1ac8319.
You can then match this ID with the one under Metrics for your investigations.
Multiple clusters
Standard Dedicated Gen 2 environments have a single cluster of three hosts, where each additional cluster adds at least three additional hosts to the project. Dedicated Gen 2 environments with two clusters display metrics in two separate groups: one for the web hosts that handle web requests and one for the service hosts that handle database, cache, and other services.
Example of how to read metrics
This example should give you an idea of how the metrics appear. Dedicated Gen 2 environments metrics show the resource usage per host within the cluster.
This reference project has a single PHP application and three services: MySQL, Redis, and Solr.
The metrics below are for a single Production environment.
Once you’ve read the metrics, see recommendations for action.
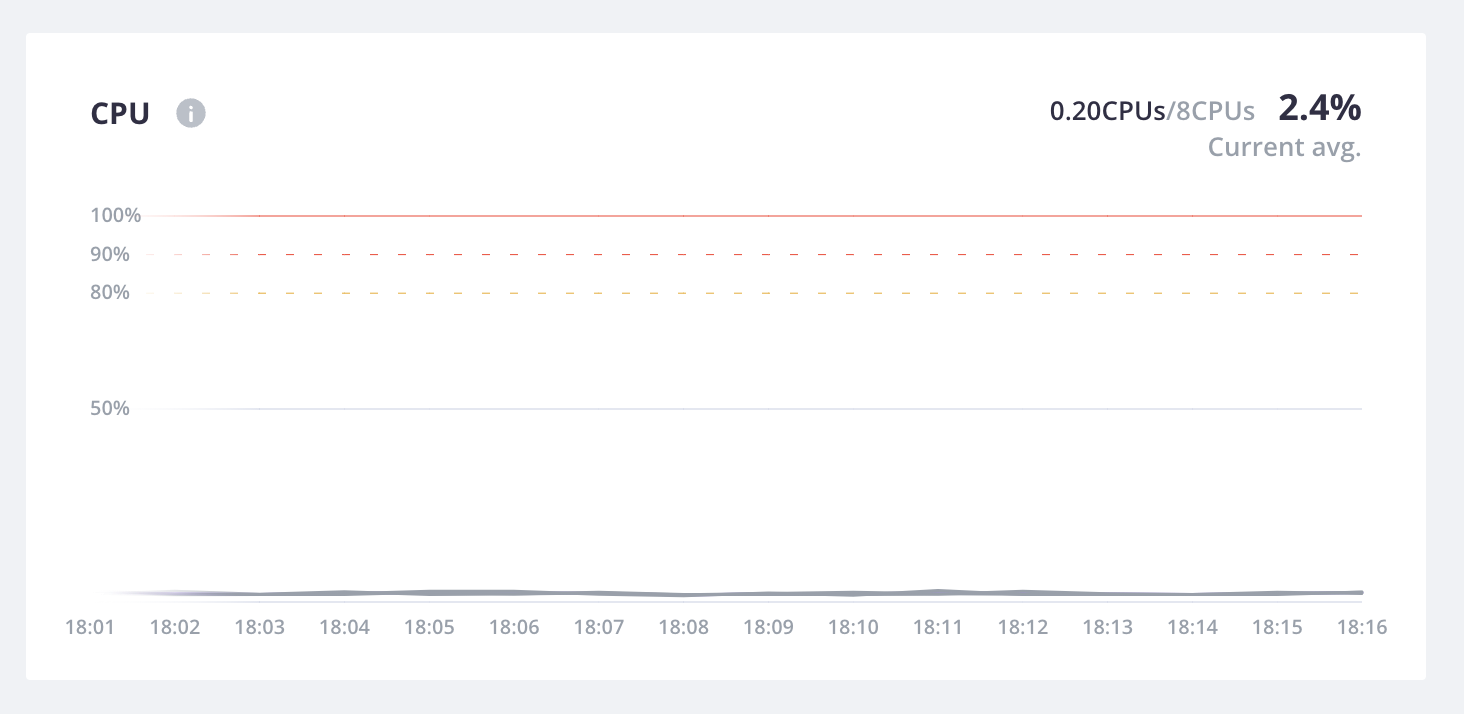
CPU
The project has 2 virtual CPUs allocated per host, as seen in the upper limit for the CPU metric.
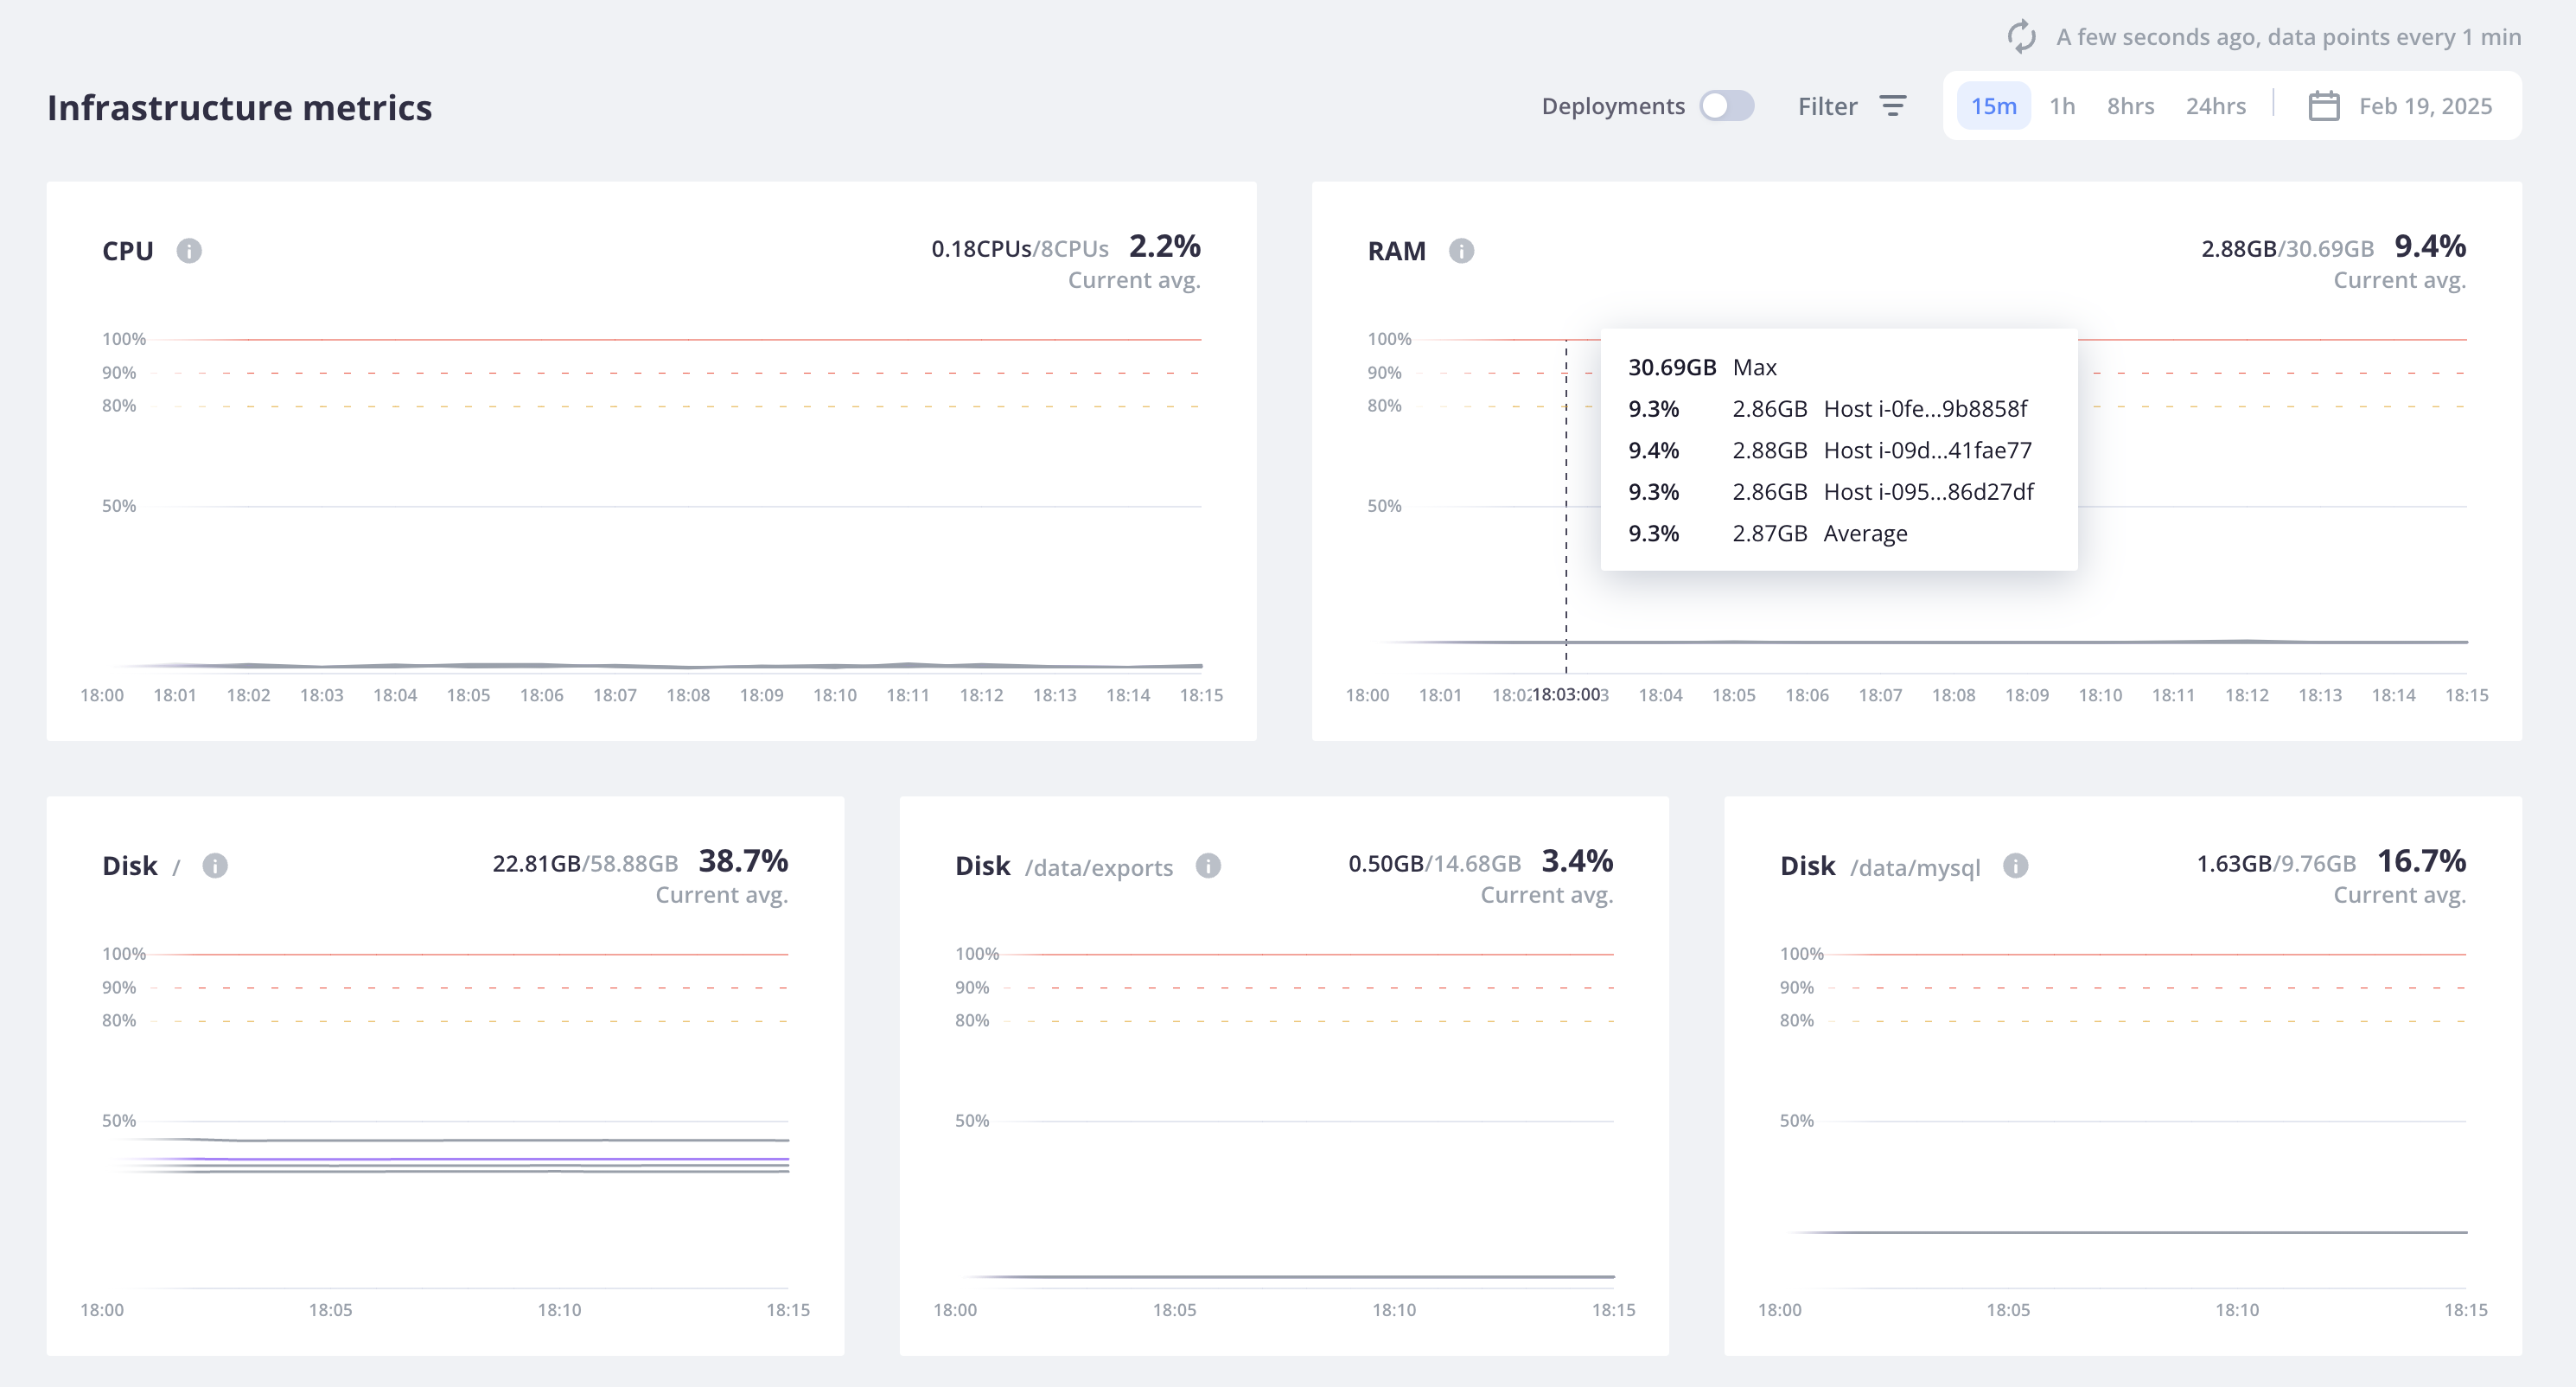
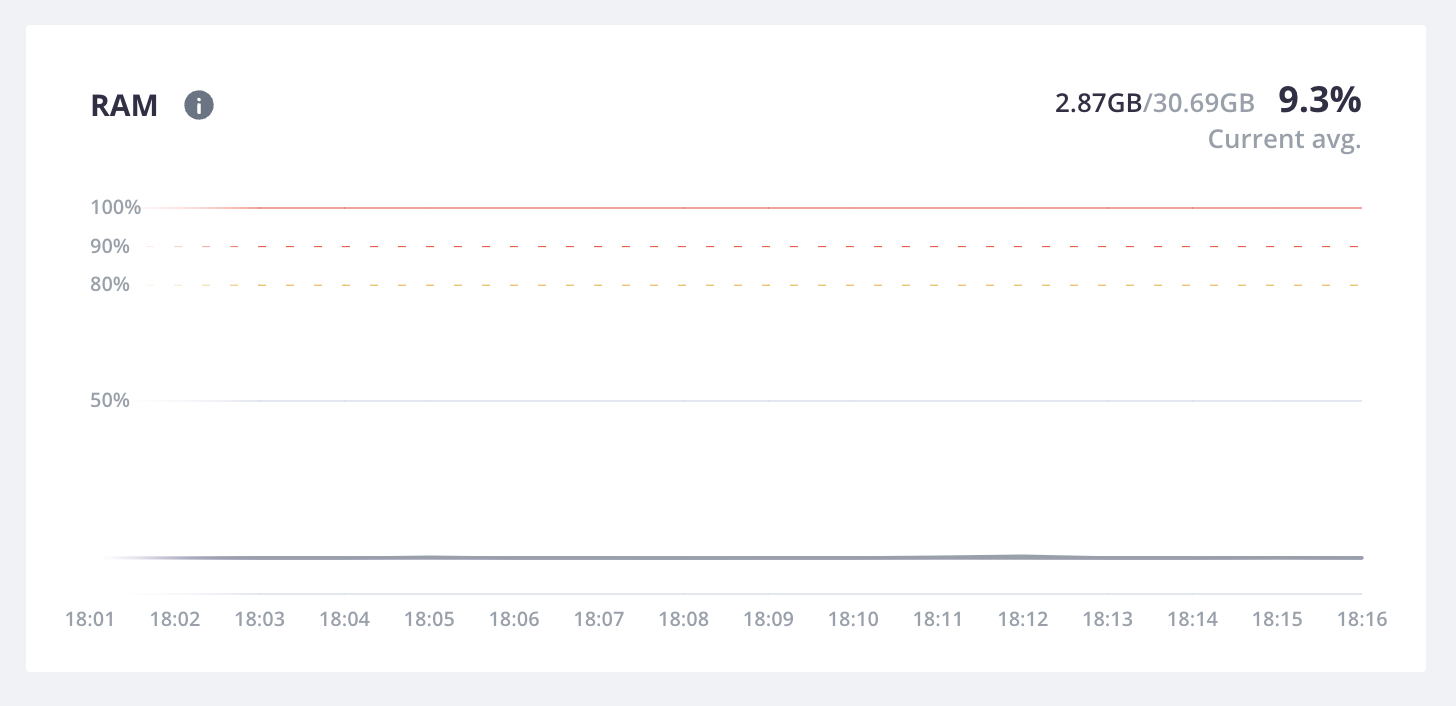
RAM
RAM measures overall RAM usage, displaying the percentage of the RAM available for each host.
For this example, each host has been granted 30.69 GB of memory. 9.3% of that memory has been used.
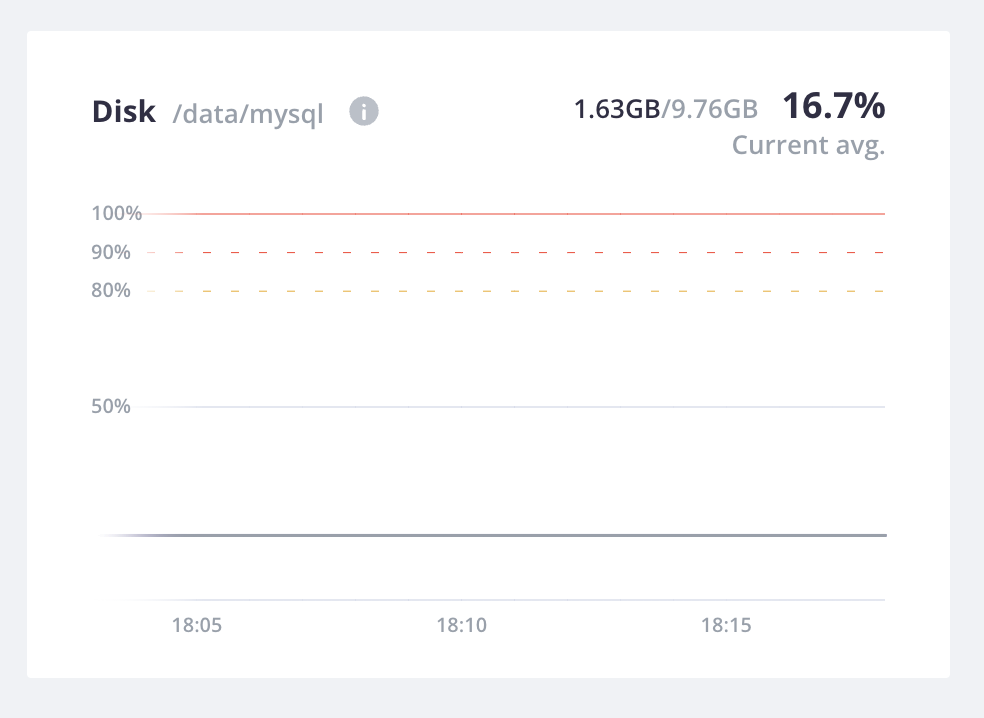
Disk
Disk represents the plan space for all services and mounts, which for Dedicated Gen 2 production environments is 50 GB.
This example has the following persistent disk space configured:
- App: 14.68 GB for the mount
exports - MySQL: 9.78 GB
- Root (
/) folder: 58.88 GB
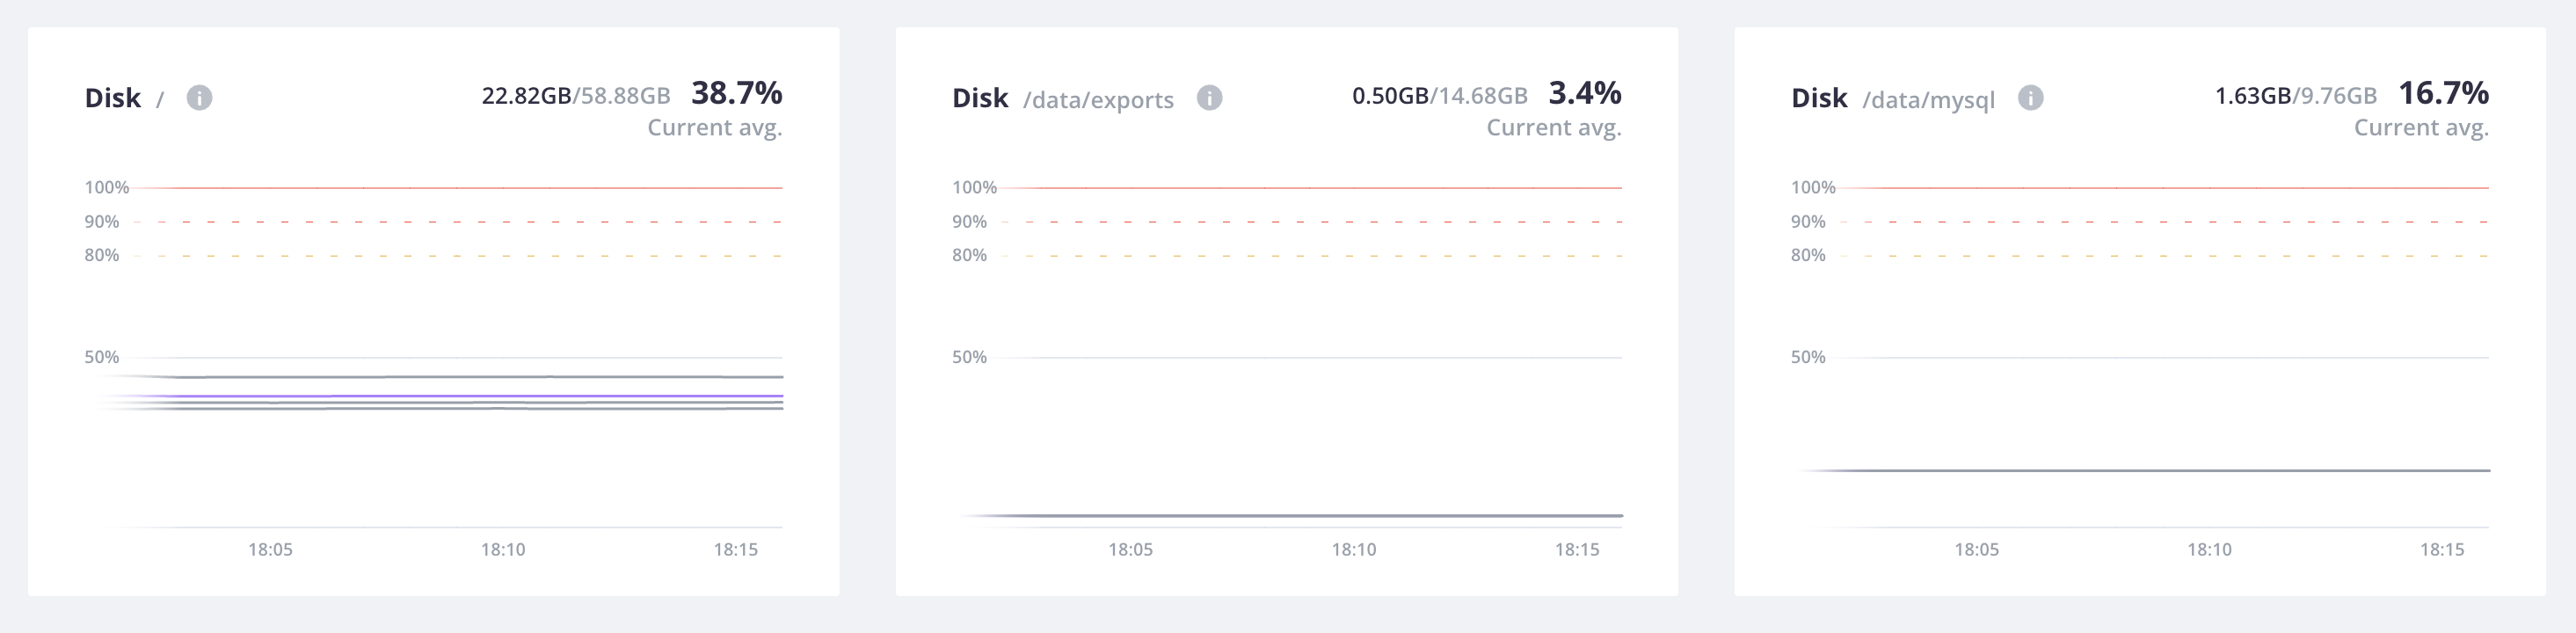
For each host, you first see metrics for the root (/) folder.
Utilizing this folder doesn’t count against the space set aside for your plan:
it’s infrastructure disk, including the /tmp directory.
It’s included in the metrics so you can keep track of build artifacts you write to /tmp
and make sure that they don’t get too large and fill up.
Next to this space comes the other defined directories: for the MySQL service and the exports mount.