Monitor metrics
Back to home
On this page
These environments consist of various containers running across dedicated hosts:
- App containers: one or more app containers
- Service containers: zero or more service containers
- Worker containers: zero or more worker instances.
Infrastructure metrics report CPU, RAM, and disk space for all containers.
By default, the graphs include all hosts and an average over the hosts. To select metrics for specific hosts, click Filter.
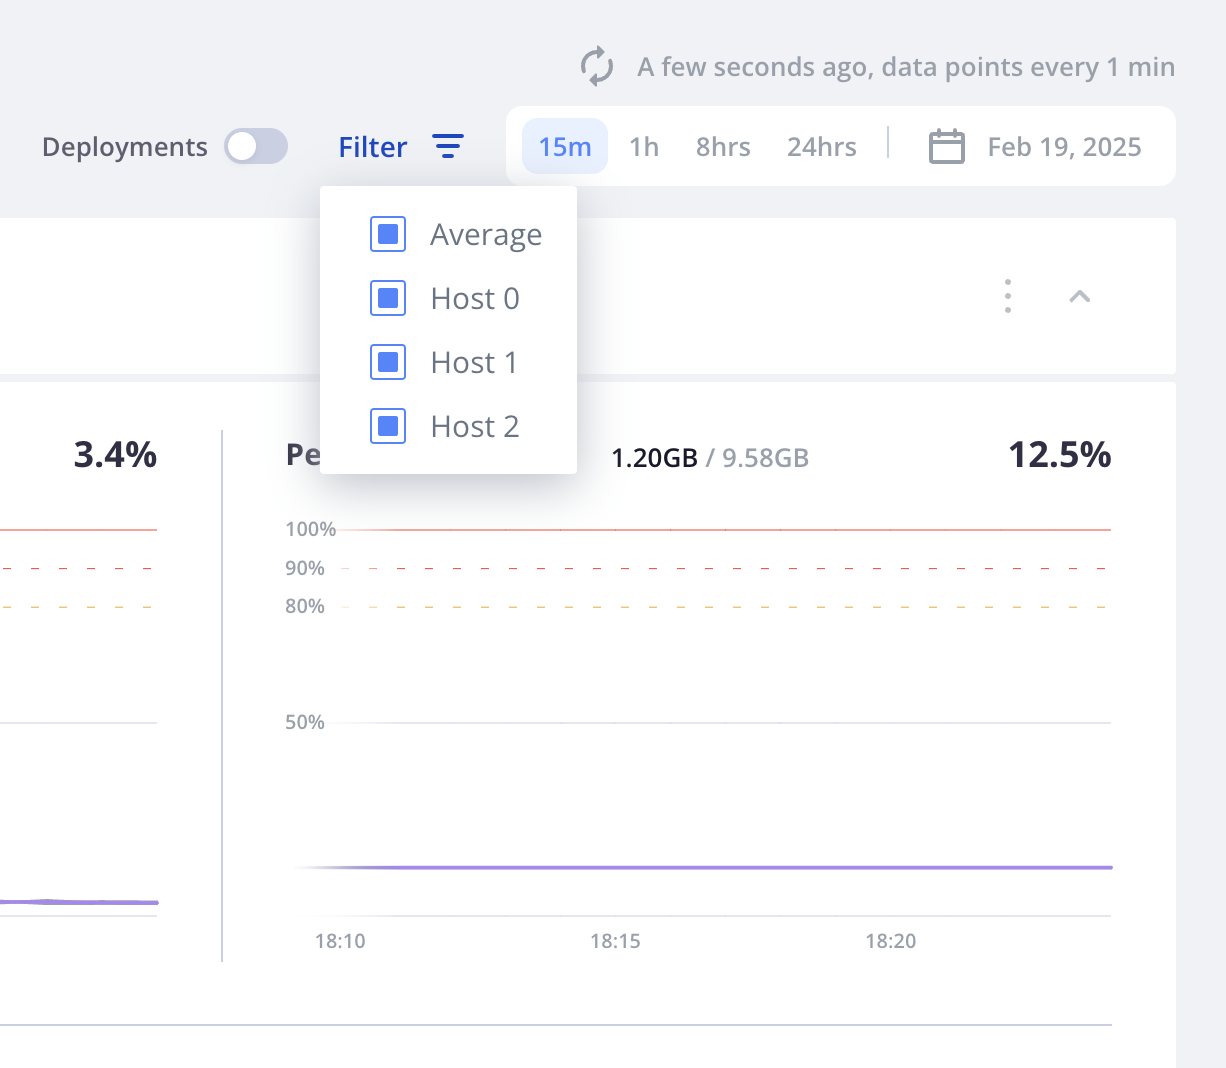
The ID numbers for the hosts in the list for filtering match the numbers for interacting with a host, such as for accessing the environment using SSH.
Each of the three hosts and their average. These metrics are available for all of your Dedicated Gen 3 environments.
Example of how to read metrics 
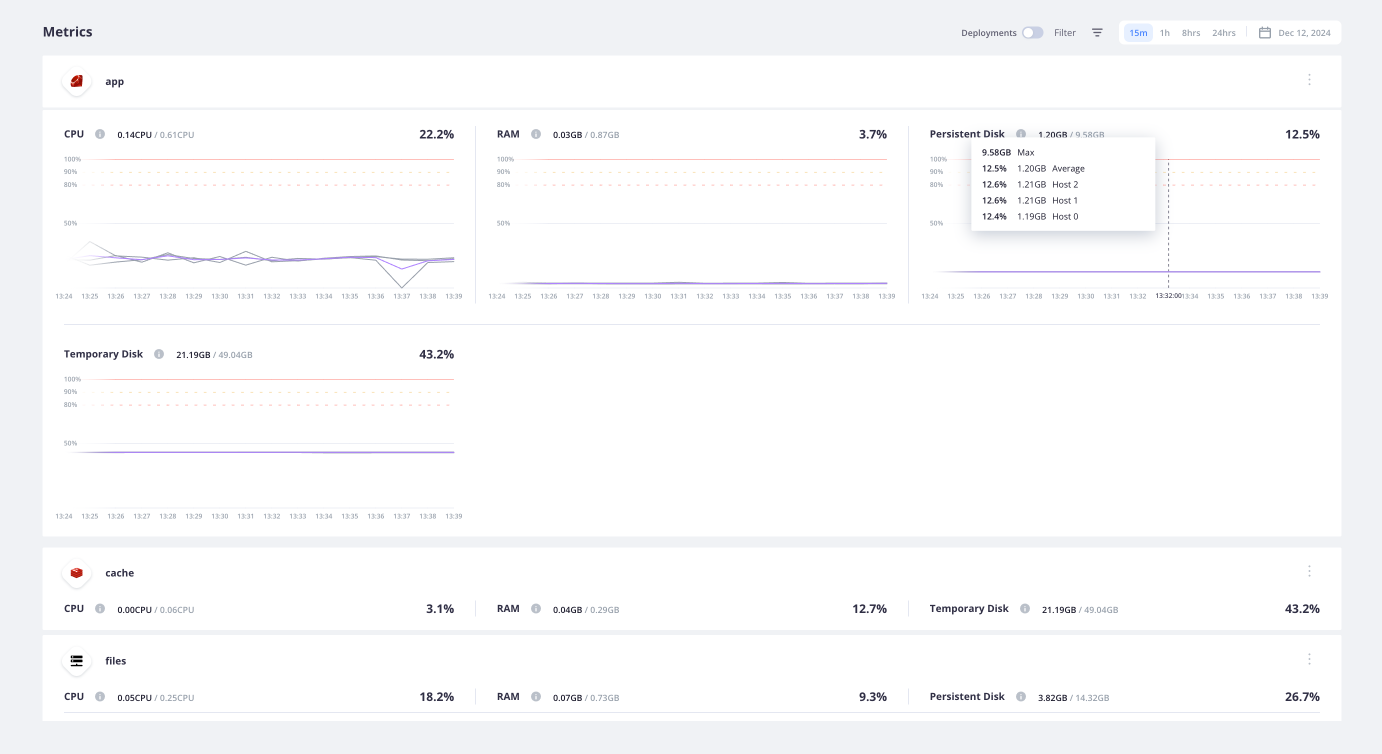
This example should give you an idea of how the metrics appear. The metrics show resource usage for each app, service, and worker container across all hosts.
This reference project has a single app, two services (PostgreSQL and Redis), and one worker.
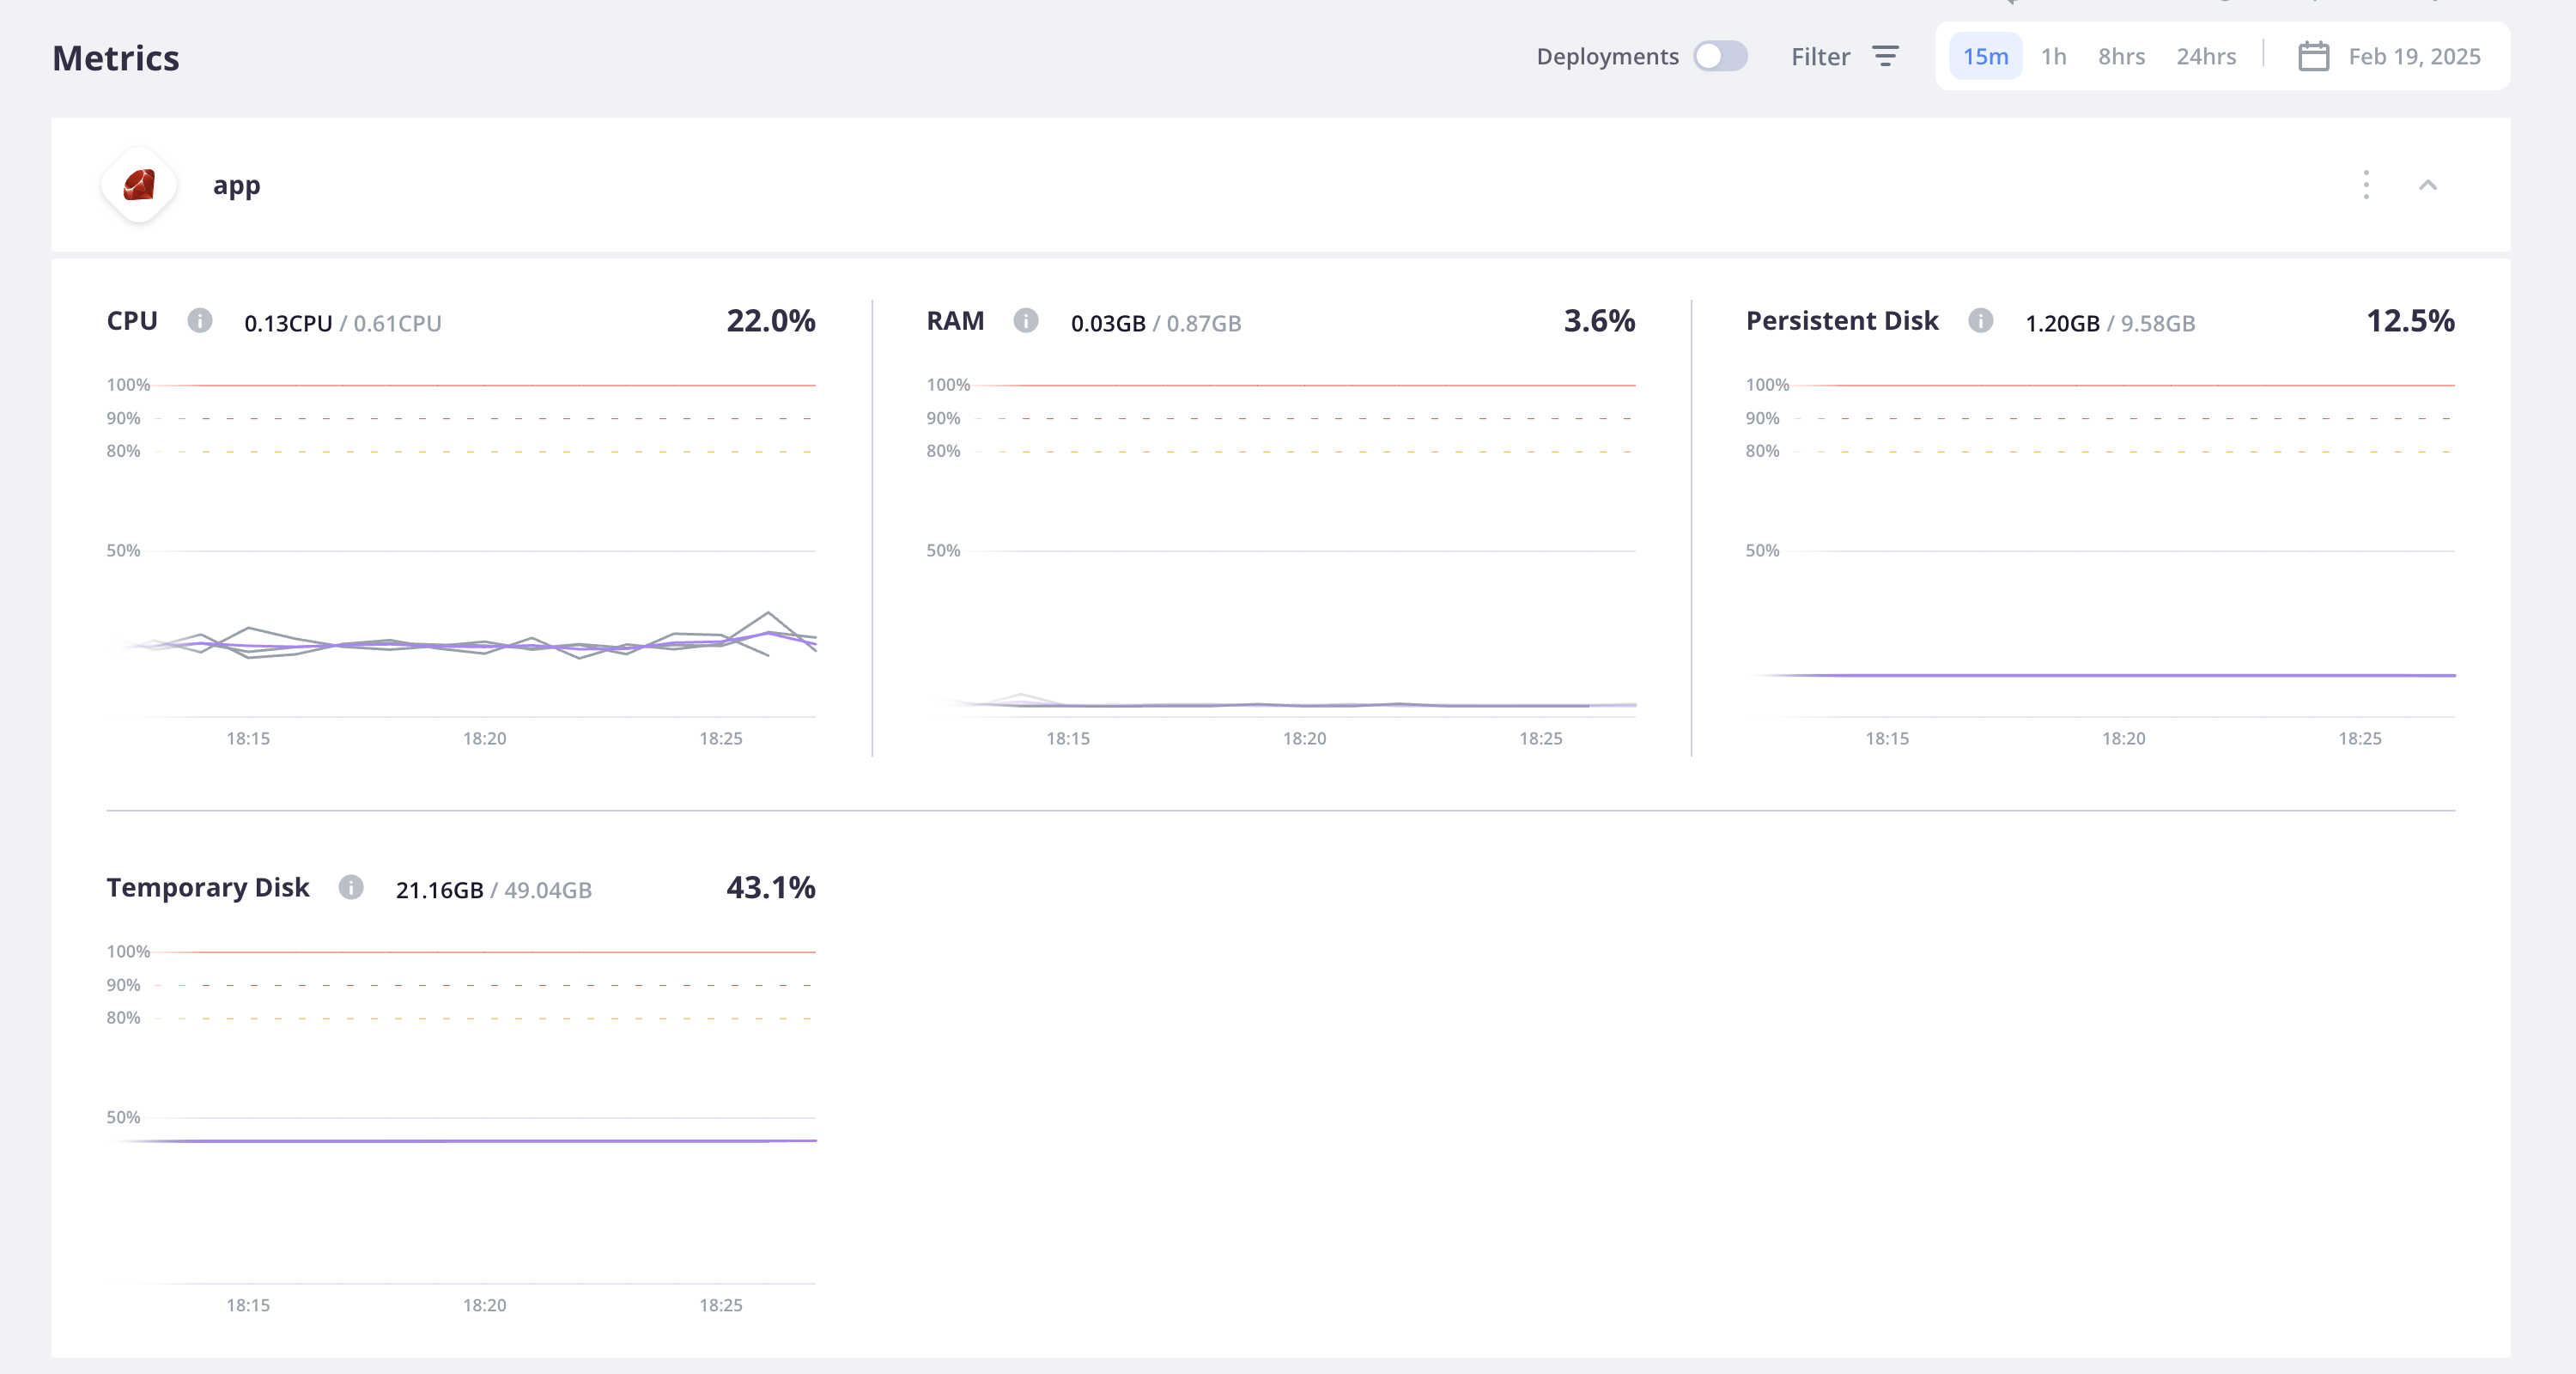
App container
Metrics graphs for the app container show CPU, RAM, and disk allocation and usage across all hosts. The persistent disk has been configured in the app configuration at 9.58 GB, while the temporary disk is 49.04 GB.
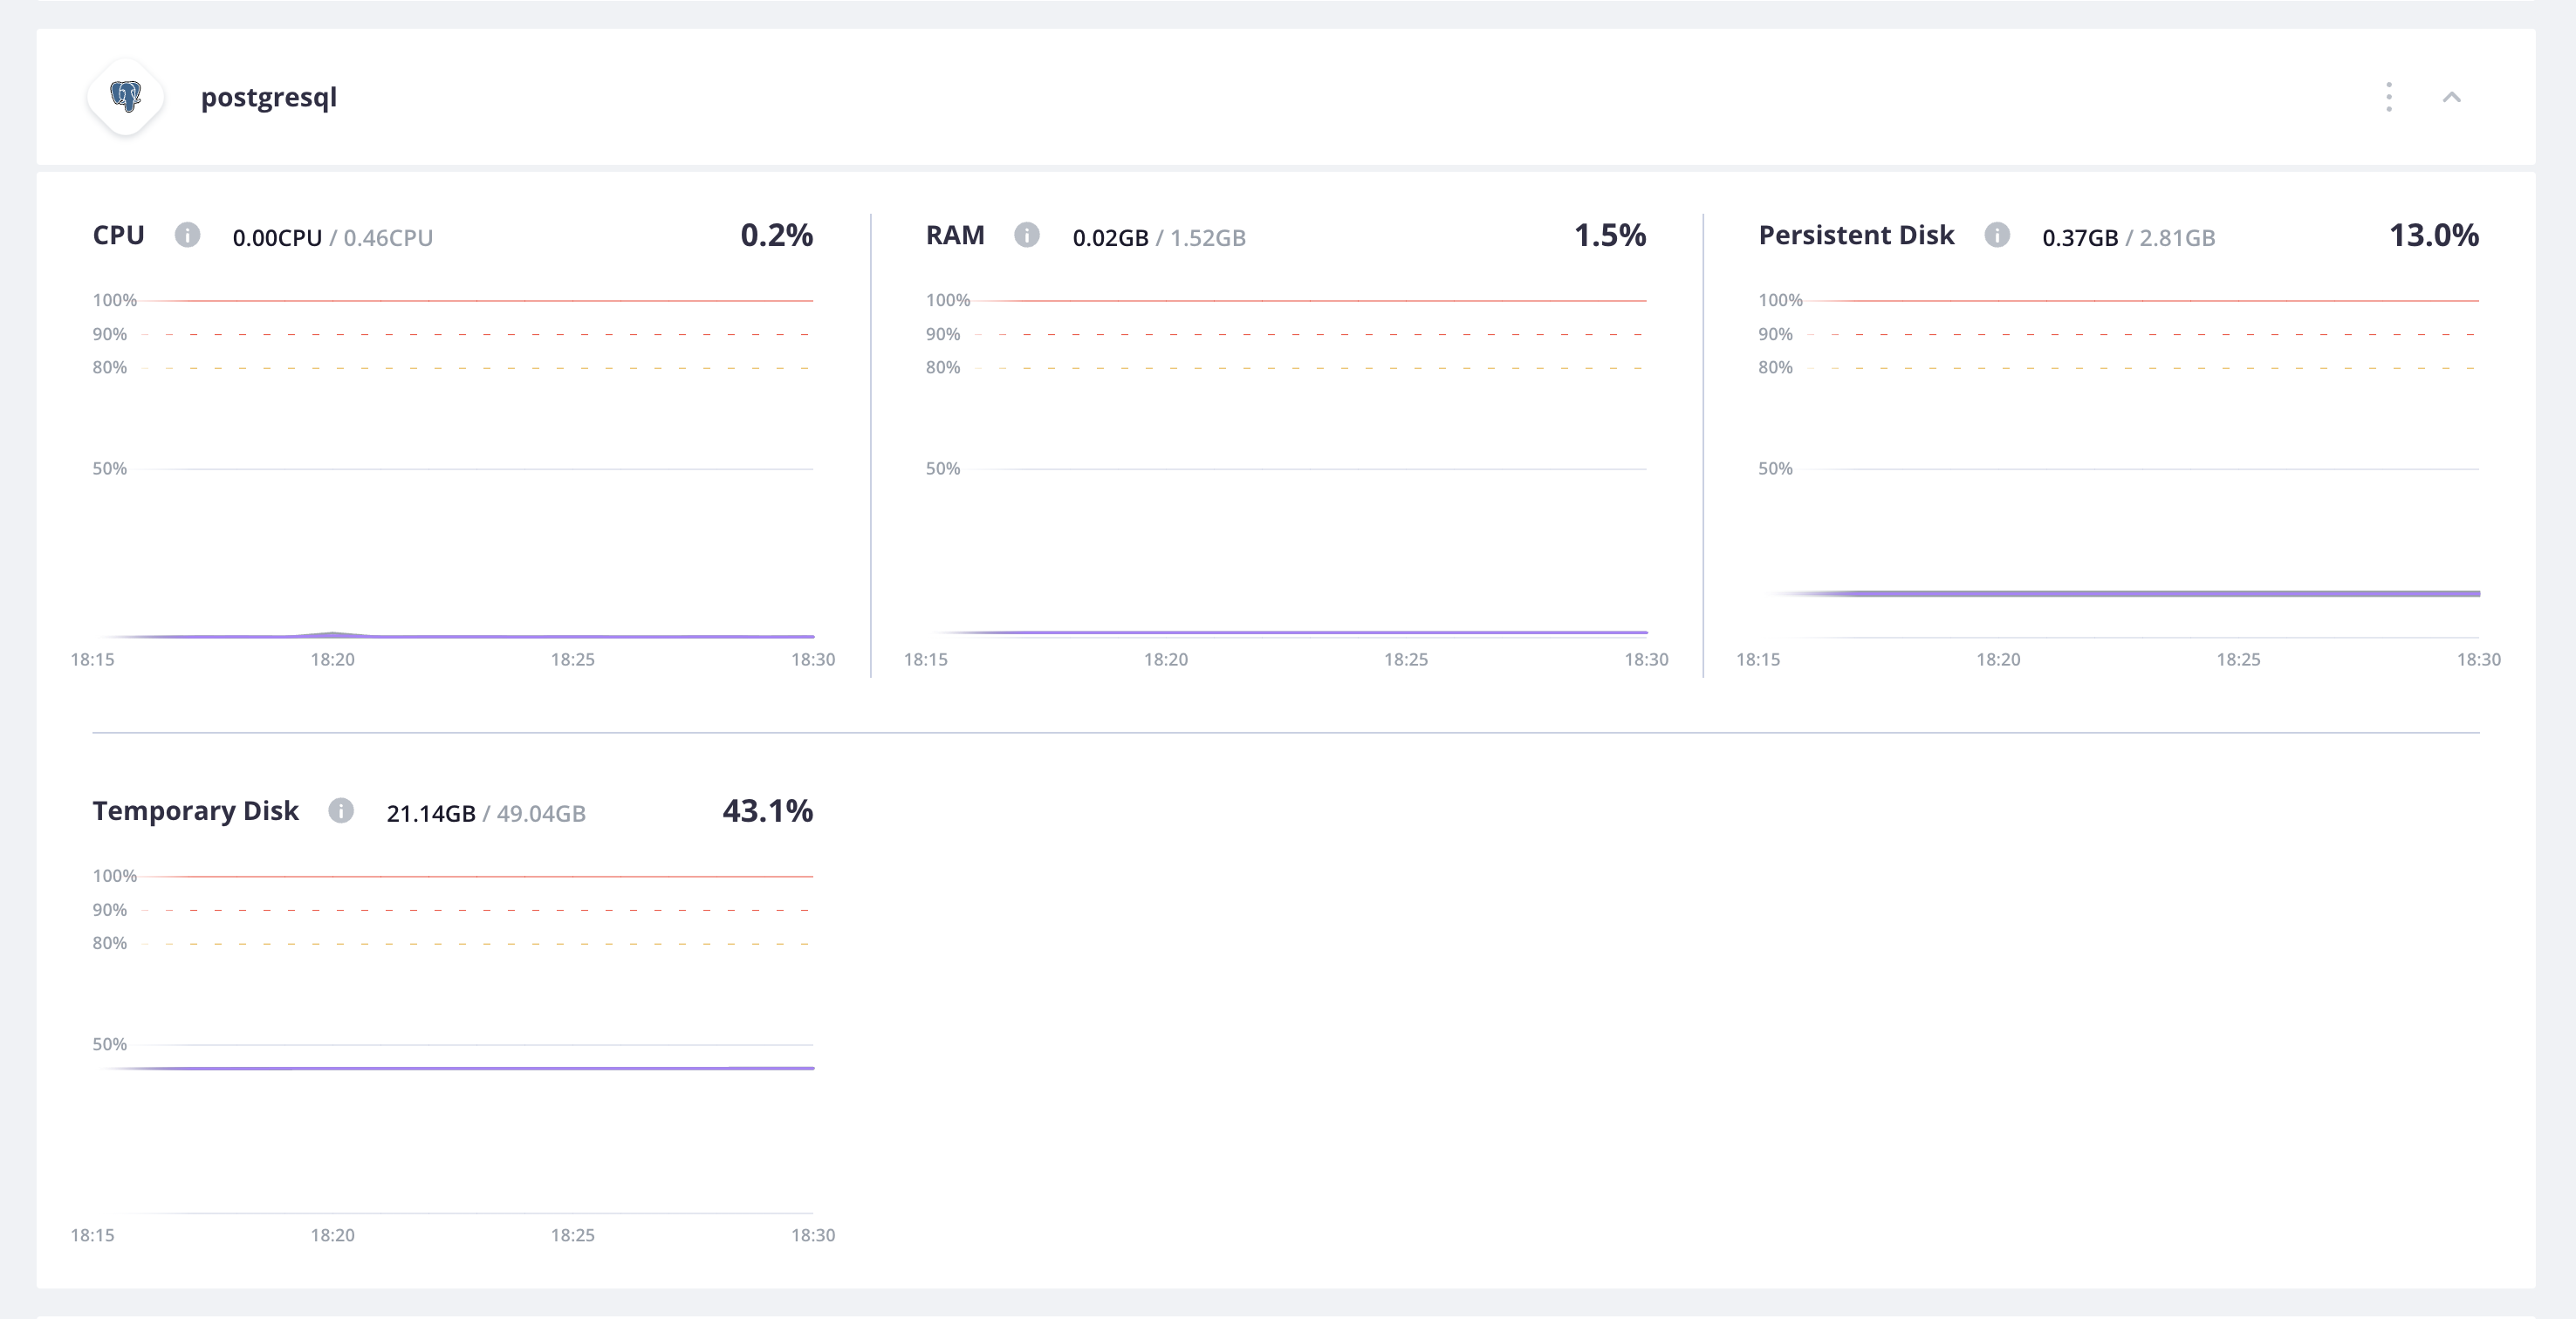
Service containers
Metrics graphs for the service containers show CPU, RAM, and disk allocation and usage across all hosts.
PostgreSQL
Metrics graphs for the PostgreSQL service container show CPU, RAM, and disk allocation and usage across all hosts. The persistent disk has been configured in the services configuration as 2.81 GB, while the temporary disk is 49.04 GB.
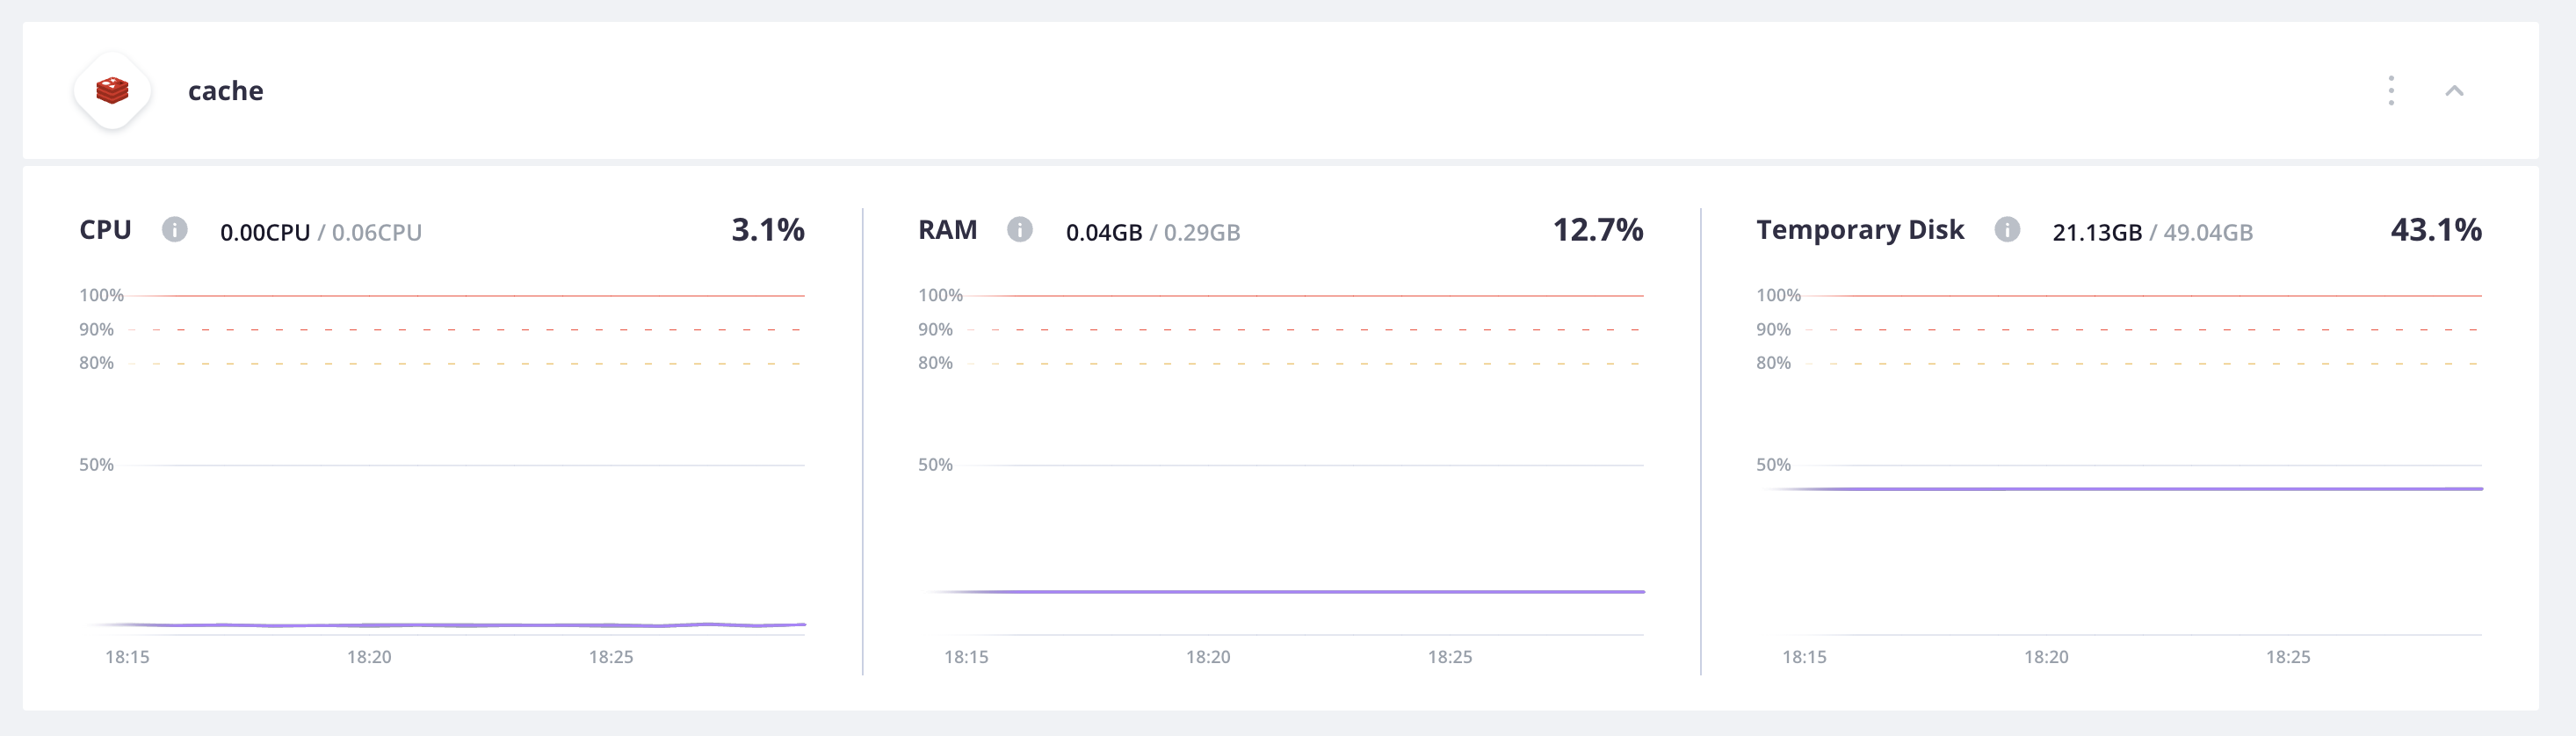
Redis
Metrics graphs for the Redis service container show CPU, RAM, and disk allocation and usage across all hosts. No persistent disk has been configured for Redis, while the temporary disk is 49.04 GB.
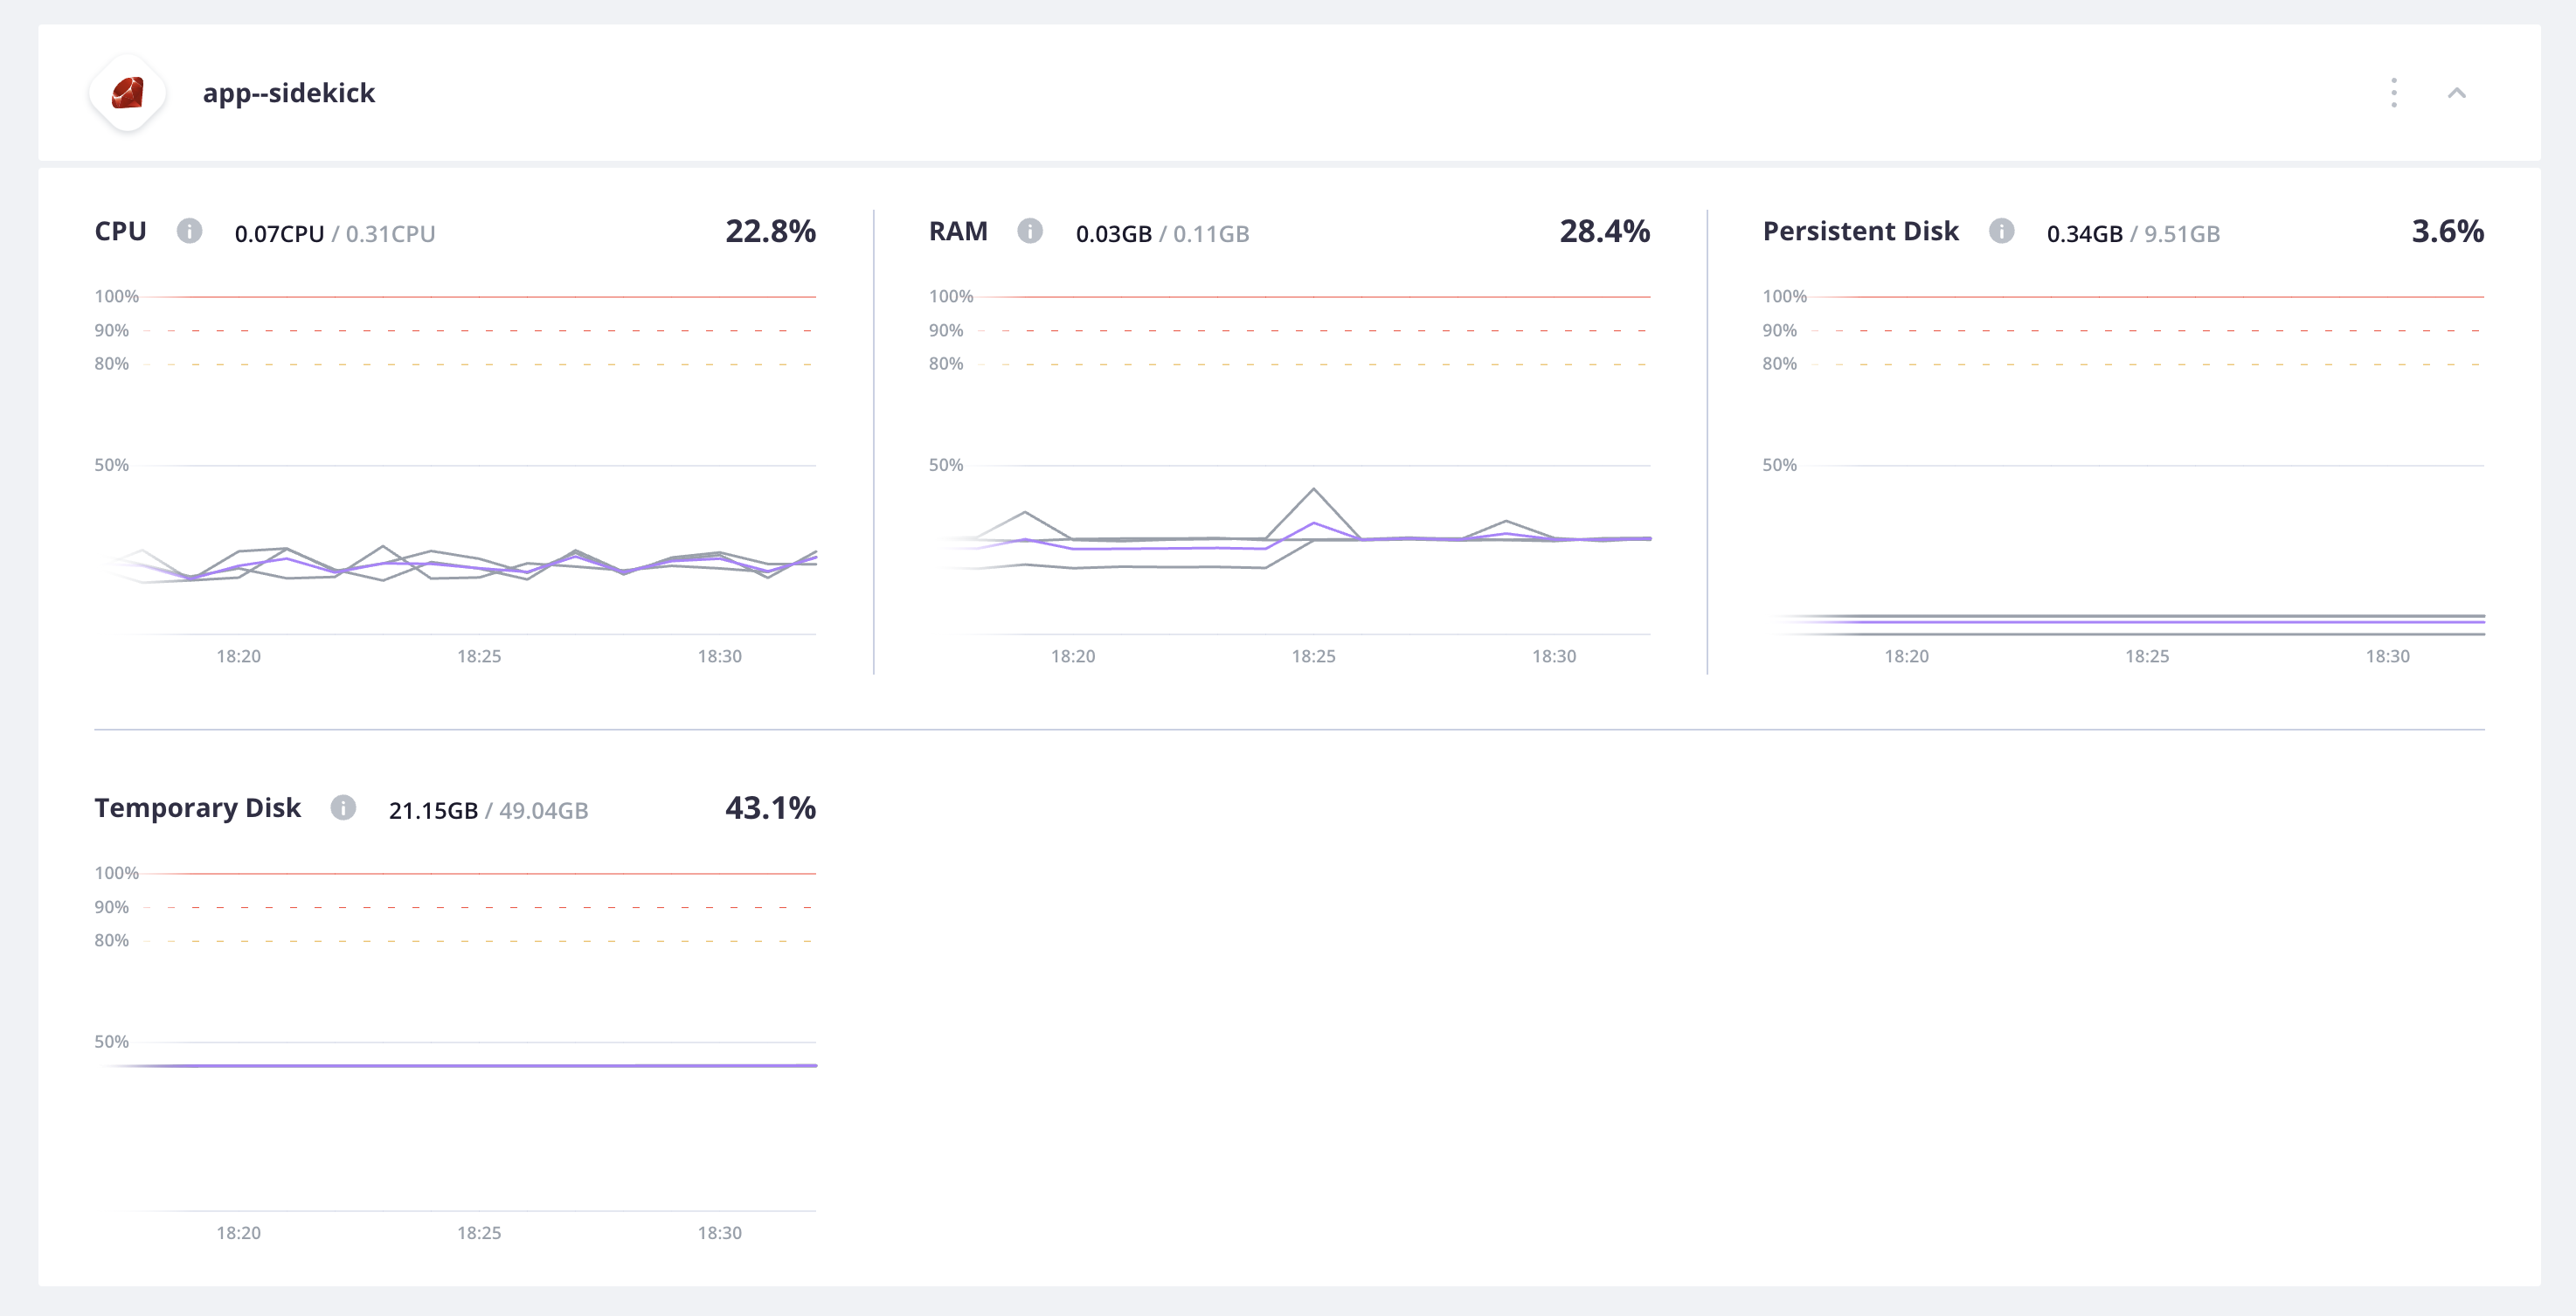
Worker container
Metrics graphs for the Scheduler worker container show CPU, RAM, and disk allocation and usage across all hosts. The persistent disk has been configured in the app configuration at 9.51 GB, while the temporary disk is 49.04 GB.
Thresholds
If you have one container in a temporary burst state but your host still has plenty of available resources, it might not be an issue as long as the site is functioning properly. Burst allows your container to use additional resources when they aren’t needed elsewhere.
If you have a container in a prolonged burst state, you might want to consider:
- Optimizing your code
- Changing your app size or service size
- Increasing your plan
You can reallocate your existing resources if other containers have resources they aren’t using.
If you have multiple containers in a burst state, review your configuration or plan size.
Burst state
Resources are dedicated to a single customer, but they’re shared between services. Therefore, burst is allowed until the dedicated resource usage is exceeded. Usage that crosses 100% will mean that you have crossed into a burst state.